Electricity, coal, and renewables
Electricity generation
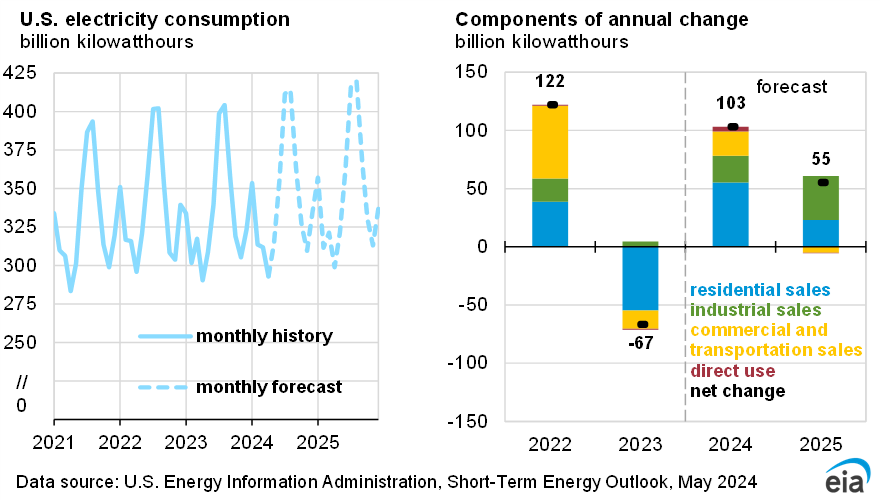
U.S. electricity generation in our forecast grows in 2024 compared with last year because warmer weather drives air-conditioning demand, manufacturing activity increases, and large-scale data centers and computing facilities expand. We expect total U.S. generation will grow by 3%, or 114 billion kilowatthours (BkWh), in 2024 and by 1%, or 33 BkWh, in 2025. Renewable energy sources supply most of that growth.
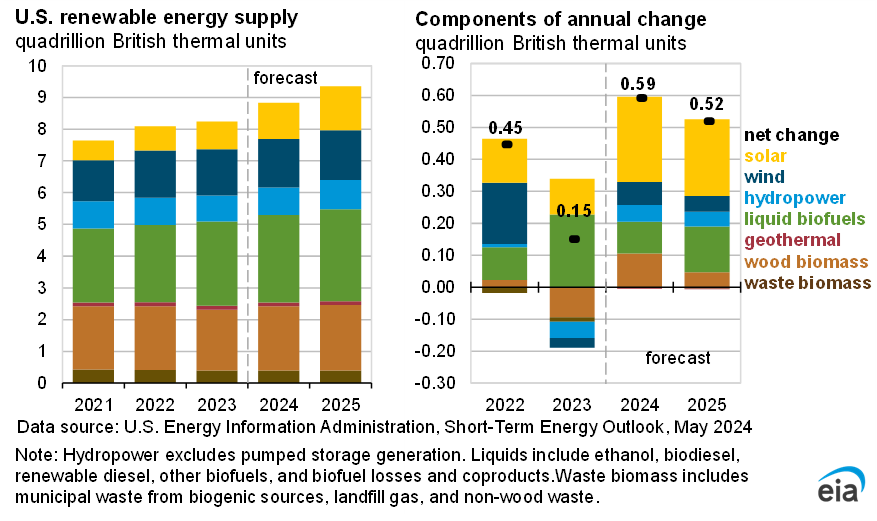
Utility-scale solar photovoltaic power plants generate 41% (66 BkWh) more electricity in 2024 in our forecast compared with 2023 as a result of 19 gigawatts (GW) of generating capacity that was added late last year and 37 GW of solar capacity scheduled to be added this year. The increase in solar generation will be especially pronounced in summer 2024 (June–September). We expect solar generation will increase a further 25% (58 BkWh) in 2025.
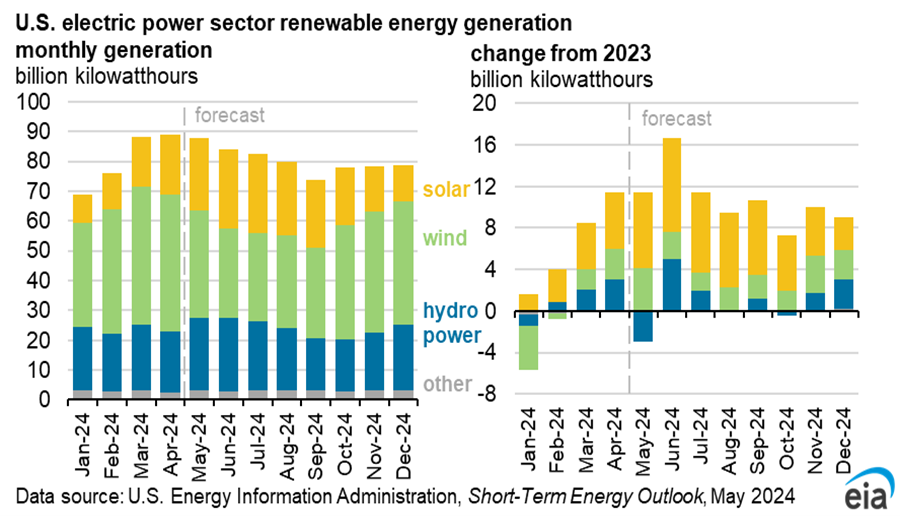
Renewables have historically generated the most electricity in the spring when output from wind turbines peaks. We expect an increase of 5% (21 BkWh) from wind generation in 2024 with about 7 GW more generating capacity at the end of April than at the same time last year. However, wind speeds in recent months have been slower than normal. If this pattern continues, annual wind generation this year could be less than expected. Our forecast of wind generation grows 3% (14 BkWh) in 2025.
Hydropower output can vary greatly from year-to-year in the United States, and hydropower generation typically peaks during the water runoff season in late spring. On an annual basis, we forecast 6% (14 BkWh) more U.S. hydropower in 2024 than in 2023. Higher water supply in key areas of the Southeast and Northwest this year are the main driver of our forecast increase in hydropower generation. Most hydropower is generated in the western half of the country, but we expect that the Southeast will be the region with the largest increase in hydroelectric generation this year (up 10%). We expect U.S. hydropower will again grow by 6% in 2025, with growth centered in the Northwest.
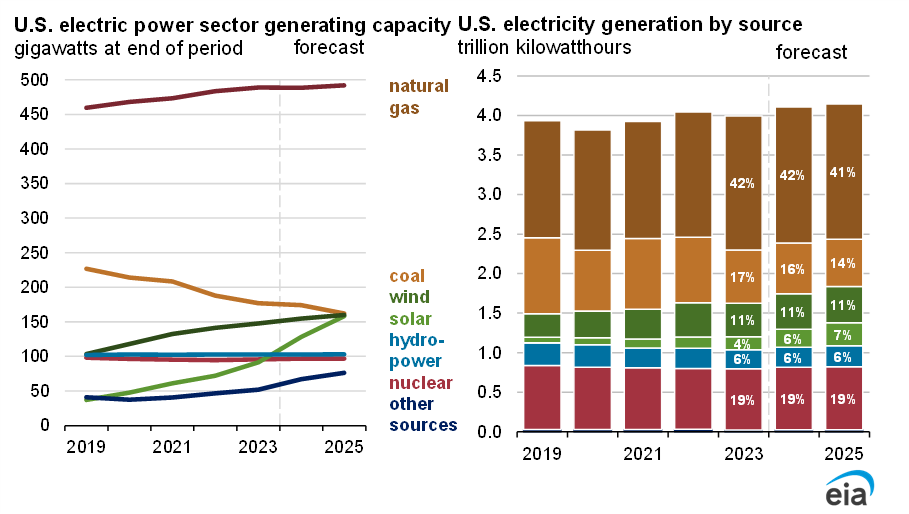
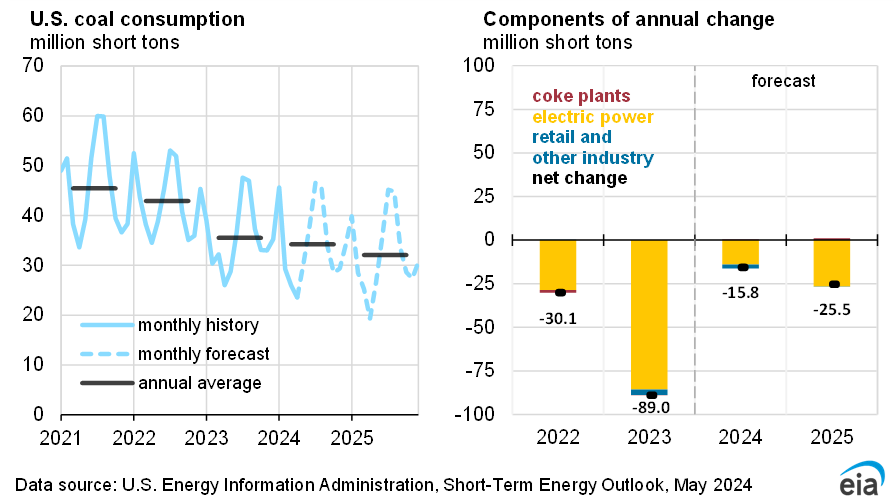
The increased generation from renewables is likely to constrain growth in generation from natural gas-fired power plants, even with relatively low natural gas prices in the forecast. We expect U.S. natural gas generation in 2024 will be relatively flat throughout the forecast period. Low natural gas prices and retirements of coal-fired capacity will continue to reduce U.S. coal generation, which we forecast will decline 4% (28 BkWh) in 2024 and 7% (48 BkWh) in 2025.
Coal markets
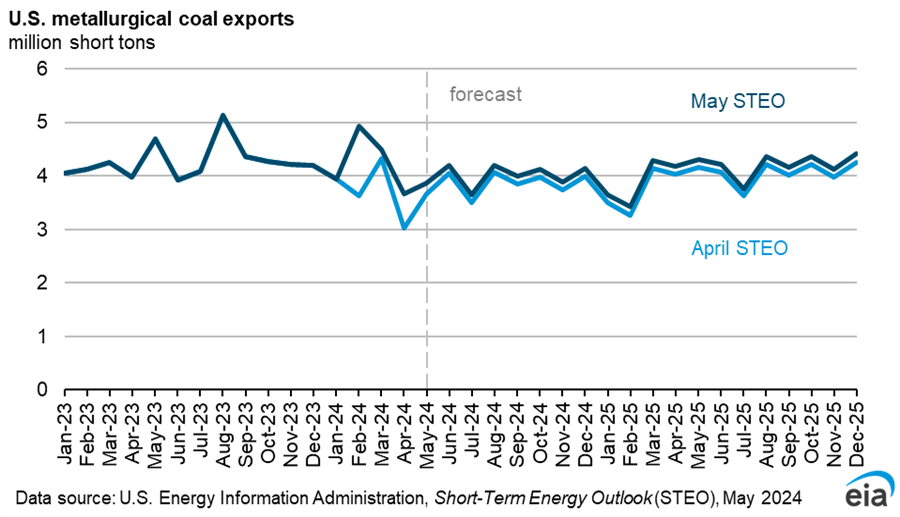
Data for metallurgical coal exports in February, which we receive with a two-month lag, were greater than we expected in the April STEO. The bulk of metallurgical coal is produced in Appalachia and roughly 20% of metallurgical coal exports flow through the Port of Baltimore. With February exports higher than we expected and efforts to clear the Port of Baltimore progressing, we expect metallurgical coal exports to total nearly 8 million short tons (MMst) in April and May, an increase of 13% from the April STEO, when uncertainty surrounding the Port of Baltimore led us to expect a significant slowdown in metallurgical coal exports. As a result, we have lifted our estimate of total coal exports in April and May 2024 to 13 MMst, up 9% from the April STEO. We now forecast coal exports in 2024 to total 99 MMst, up 4% from the April STEO, and we expect exports to rise to 106 MMst in 2025.
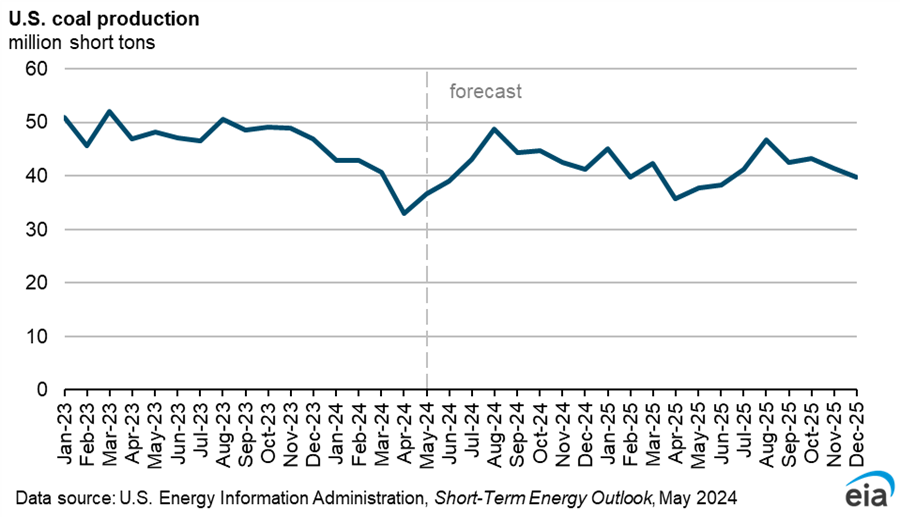
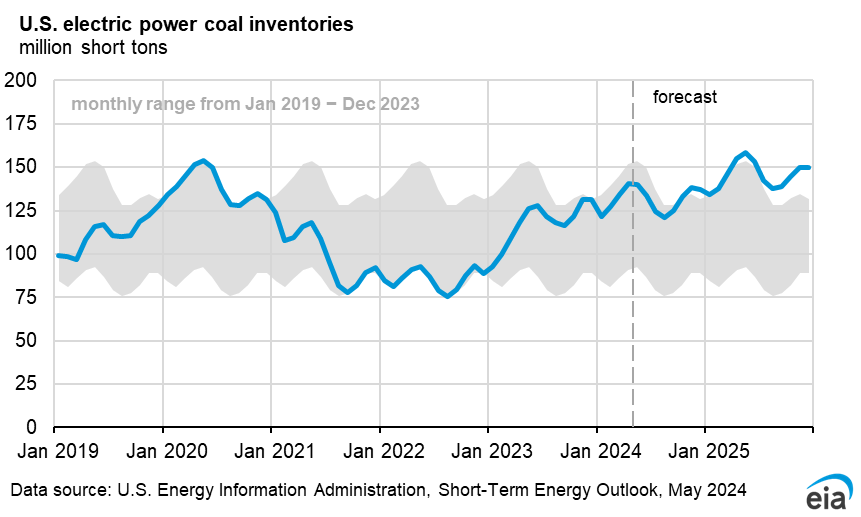
Coal production declined by 19% from March to April. Production fell as miners reduced activity because the coal industry was starting the shoulder season with increasing inventories. We expect production to increase in subsequent months, peaking at 49 MMst in August before declining through the end of the year. Our expectation of more coal exports than in last month’s STEO contributed to a 3% increase in our forecast for coal production in 2024. We now expect U.S. coal production will total about 500 MMst in 2024 and decline by about 1% to near 490 MMst next year.