|
Home >
Forecasts & Analyses > The National Energy Modeling System: An Overview > Transportation Demand Module
|
The National Energy Modeling System: An Overview
|
Full Printer-Friendly Version |
|
Find on this page:
Transportation Demand Module
|
|
| Transportation Demand Module |
|
|
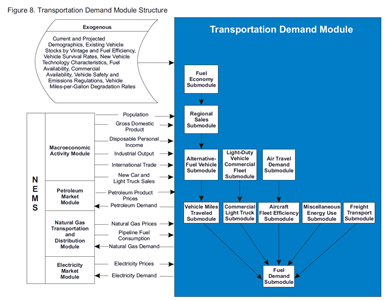
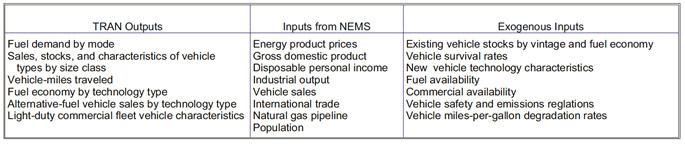
The transportation demand module (TRAN) projects the consumption of transportation
sector fuels by transportation mode, including the use of renewables
and alternative fuels, subject to delivered prices of energy and macroeconomic
variables, including disposable personal income, gross domestic product,
level of imports and exports, industrial output, new car and light truck
sales, and population. The structure of the module is shown in Figure 8.
Projections of future fuel prices influence fuel efficiency, vehicle-miles
traveled, and alternative-fuel vehicle (AFV) market penetration for
the current fleet of vehicles. Alternative-fuel vehicle shares are projected
on the basis of a multinomial logit model, subject to State and Federal
government mandates for minimum AFV sales volumes. |
 |
|
Click for a larger version |
| Fuel Economy Submodule |
|
back to top |
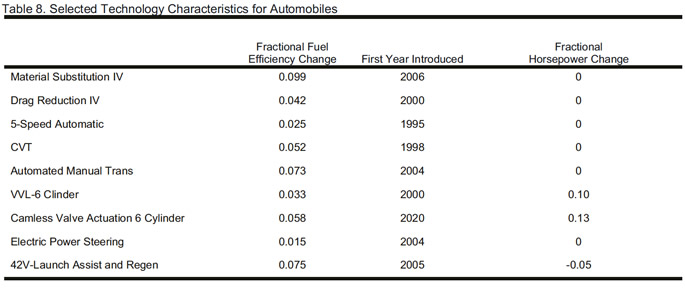
This submodule projects new light-duty vehicle fuel economy by 12 U.S.
Environmental Protection Agency (EPA) vehicle size classes and 16 propulsion
technologies (gasoline, diesel, and 14 AFV technologies) as a function
of energy prices and income-related variables. There are 61 fuel-saving
technologies which vary in cost and marginal fuel savings by size class.
Characteristics of a sample of these technologies are shown in Table 8 below,
a complete list is published in Assumptions to the Annual Energy Outlook
2009.14 Technologies penetrate the market based on a cost- effectiveness
algorithm that compares the technology cost to the discounted stream
of fuel savings and the value of performance to the consumer. In general,
higher fuel prices lead to higher fuel efficiency estimates within each size class, a shift to a more fuel-efficient size class mix,
and an increase in the rate at which alternative-fuel vehicles enter the
marketplace.
|
|
|
|
|
| Regional Sales Submodule |
|
back to top |
Vehicle sales from the MAM are divided into car and light truck
sales. The remainder of the submodule is a simple accounting mechanism
that uses endogenous estimates of new car and light truck sales and
the historical regional vehicle sales adjusted for regional population
trends to produce estimates of regional sales, which are subsequently passed
to the alternative-fuel vehicle and the light-duty vehicle stock submodules. |
|
|
|
| Alternative-Fuel Vehicle Submodule |
|
back to top |
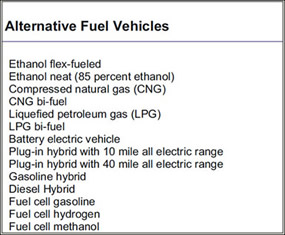
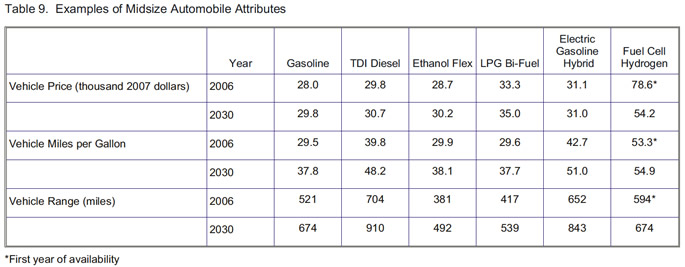
This submodule projects the sales shares of alternative-fuel technologies
as a function of technology attributes, costs, and fuel prices. The alternative-fuel
vehicles attributes are shown in Table 9 below, derived from Assumptions to the
Annual Energy Outlook 2009. Both conventional and new technology vehicles
are considered. The alternative-fuel vehicle submodule receives regional
new car and light truck sales by size class from the regional sales submodule.
The projection of vehicle sales by technology utilizes a nested multinomial
logit (NMNL) model that predicts sales shares based on relevant vehicle
and fuel attributes. The nesting structure first predicts the probability
of fuel choice for multi-fuel vechicles within a technology set. The second
level nesting predicts penetration among similar technologies within
a technology set (i.e. gasoline versus diesel hybrids). The third level
choice determines market share among the the different technology sets.15
The technology sets include:
- Conventional fuel capable (gasoline, diesel, bi-fuel and flex-fuel),
- Hybrid (gasoline and diesel) and plug-in hybrid
- Dedicated alternative fuel (compressed natural gas (CNG), liquified petroleum
gas (LPG), and ethanol),
- Fuel cell (gasoline, methanol, and hydrogen),
- Electric battery powered (nickel-metal hydride, lithium)
The vehicles attributes considered in the choice algorithm include: price,
maintenance cost, battery replacement cost, range, multi-fuel capability,
home refueling capability, fuel economy, acceleration and luggage space.
With the exception of maintenance cost, battery replacement cost, and luggage
space, vehicle attributes are determined endogenously.16 The fuel attributes
used in market share estimation include availability and price. Vehicle
attributes vary by six EPA size classes for cars and light trucks and fuel
availability varies by Census division. The NMNL model coefficients were
developed to reflect purchase preferences for cars and light trucks separately.
| |
|
|
|
| Light-Duty Vehicle (LDV) Stock Submodule |
|
back to top |
This submodule specifies the inventory of LDVs from year to year. Survival
rates are applied to each vintage, and new vehicle sales are introduced
into the vehicle stock through an accounting framework. The fleet of vehicles
and their fuel efficiency characteristics are important to the translation
of transportation services demand into fuel demand.
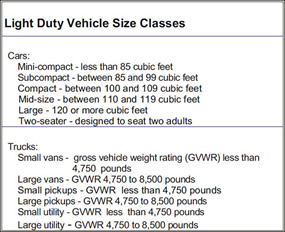
TRAN maintains a level of detail that includes twenty vintage classifications
and six passenger car and six light truck size classes corresponding to
EPA interior volume classifications for all vehicles less than 8,500 pounds,
as follows:
|
|
|
| Vehicle-Miles Traveled (VMT) Submodule |
|
back to top |
This submodule projects travel demand for automobiles and light trucks.
VMT per capita estimates are based on the fuel cost of driving per mile
and per capita disposable personal income. Total VMT is calculated by multiplying
VMT by the number of licensed drivers. |
|
|
| LDV Commercial Fleet Submodule |
|
back to top |
This submodule generates estimates of the stock of cars and trucks used
in business, government, and utility fleets. It also estimates travel demand,
fuel efficiency, and energy consumption for the fleet vehicles prior to
their transition to the private sector at predetermined vintages. |
| |
|
| Commercial Light Truck Submodule |
|
back to top |
The commercial light truck submodule estimates sales, stocks, fuel efficiencies,
travel, and fuel demand for all trucks greater than 8,500 pounds and less
than 10,000 pounds gross vehicle weight rating. |
|
|
|
| Air Travel Demand Submodule |
|
back to top |
This submodule estimates the demand for both passenger and freight air
travel. Passenger travel is projected by domestic travel (within the U.S.),
international travel (between U.S. and Non U.S.), and Non U.S. travel.
Dedicated air freight travel is estimated for U.S. and Non U.S. demand.
In each of the market segments, the demand for air travel is estimated
as a function of the cost of air travel (including fuel costs) and economic
growth (GDP, disposable income, and merchandise exports). |
|
|
|
| Aircraft Fleet Efficiency Submodule |
|
back to top |
This submodule projects the total world-wide stock and the average fleet
efficiency of narrow body, wide body, and regional jets required to meet
the projected travel demand. The stock estimation is based on the growth
of travel demand and the flow of aircraft into and out of the United States
The overall fleet efficiency is determined by the weighted average of the
surviving aircraft efficiency (including retrofits) and the efficiencies
of the newly acquired aircraft. Efficiency improvements of new aircraft
are determined by projecting the market penetration of advanced aircraft
technologies |
|
|
|
| Freight Transport Submodule |
|
back to top |
This submodule translates NEMS estimates of industrial production into
ton-miles traveled for rail and ships and into vehicle vehicle-miles traveled
for trucks, then into fuel demand by mode of freight travel. The freight
truck stock is subdivided into medium and heavy-duty trucks. VMT freight
estimates by truck size class and technology are based on matching freight
needs, as measured by the growth in industrial output by NAICS code, to
VMT levels associated with truck stocks and new vehicles. Rail and shipping
ton-miles traveled are also estimated as a function of growth in industrial
output.
Freight truck fuel efficiency growth rates are tied to historical growth
rates by size class and are also dependent on the maximum penetration,
introduction year, fuel trigger price (based on cost-effectiveness), and
fuel economy improvement of advanced technologies, which include alternative-fuel technologies.
A subset of the technology characteristics are shown in Table 10. In the
rail and shipping modes, energy efficiency estimates are structured to
evaluate the potential of both technology trends and efficiency improvements
related to energy prices. |
|
|
|
| Miscellaneous Energy Use Submodule |
|
back to top |
This submodule projects the use of energy in military operations, mass
transit vehicles, recreational boats, and lubricants, based on endogenous
variables within NEMS (e.g., vehicle fuel efficiencies) and exogenous variables
(e.g., the military budget). |
|
|
|
Preface and Contacts
Appendix
Notes and Sources |
|
|
|
|