|
|
||||||||||||||
|
The National Energy Modeling System: An Overview
|
Full Printer-Friendly Version |
|||||||||||||
|
|
||||||||||||||
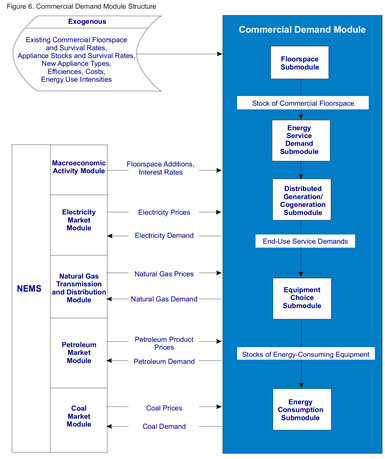
| Commercial Demand Module | ||||||||||||||
|---|---|---|---|---|---|---|---|---|---|---|---|---|---|---|
|
|
|||||||||||||
| Floorspace Submodule | back to top | |||||||||||||
|
||||||||||||||
| Energy Service Demand Submodule | back to top | |||||||||||||
|
||||||||||||||
| Distributed Generation and CHP Submodule | back to top | |||||||||||||
Commercial consumers may decide to purchase equipment to generate electricity (and perhaps provide heat as well) rather than depend on purchased electricity to fulfill all of their electric power requirements. The third step of the commercial module structure is to project electricity generation, fuel consumption, water heating, and space heating supplied by eleven distributed generation and CHP technologies. The technologies characterized include: photovoltaic solar systems, wind turbines, natural gas fuel cells, reciprocating engines, turbines and microturbines, diesel engine, coal-fired CHP, and municipal solid waste, wood, and hydroelectric generators. Existing electricity generation by CHP technologies is derived from historical data contained in the most recent year’s version of Form EIA-860, Annual Electric Generator Report. The estimated units form the installed base of CHP equipment that is carried forward into future years and supplemented with any additions. Proven installations of solar photovoltaic systems, wind turbines and fuel cells are also included based on information from the Departments of Energy and Defense. For years following the base year, an endogenous projection of distributed generation and CHP is developed based on the economic returns projected for distributed generation technologies. A detailed discounted cash-flow approach is used to estimate the internal rate of return for an investment. The calculations include the annual costs (down payments, loan payments, maintenance costs, and fuel costs) and returns (tax deductions, tax credits, and energy cost savings) from the investment covering a 30-year period from the time of the investment decision. Penetration of these technologies is a function of how quickly an investment in a technology is estimated to recoup its flow of costs. In terms of NEMS projections, investments in distributed generation reduce purchases of electricity. Fuel consuming technologies also generate waste heat that is assumed to be partially captured and used to offset commercial water heating and space heating energy use. |
||||||||||||||
| Equipment Choice Submodule | back to top | |||||||||||||
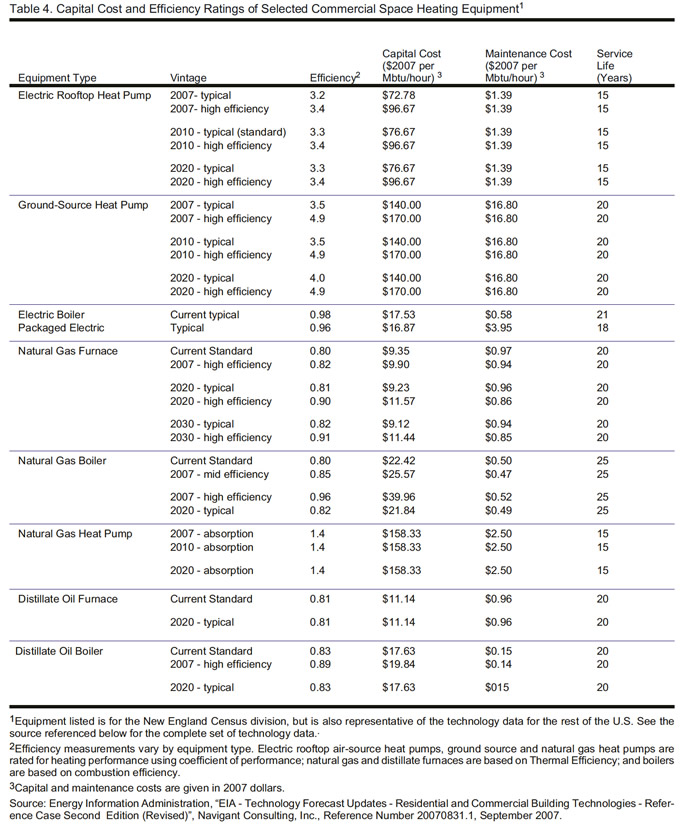
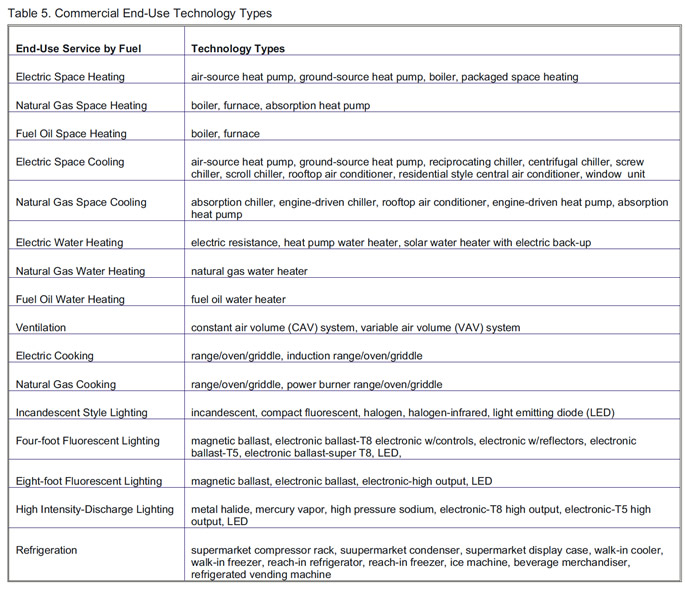
Once service demands are projected, the next step is to define the type and efficiency of equipment that will be used to satisfy the demands. The bulk of equipment required to meet service demand will carry over from the equipment stock of the previous model year. However, equipment must always be purchased to satisfy service demand for new construction. It must also be purchased to replace equipment that has either worn out (replacement equipment) or reached the end of its economically useful life (retrofit equipment). For required equipment replacements, CDM uses a constant decay rate based on equipment life. A technology will be retrofitted only if the combined annual operating and maintenance costs plus annualized capital costs of a potential technology are lower than the annual operating and maintenance costs of an existing technology. Equipment choices are made based on a comparison of annualized capital and operating and maintenance costs across all allowable equipment for a particular end-use service. In order to add inertia to the equipment choices, only subsets of the total menu of potentially available equipment may be allowed for defined market segments. For example, only 7 percent of floorspace in large office buildings may consider all available equipment using any fuel or technology when making space heating equipment replacement decisions. A second segment equal to 31 percent of floorspace, must select from technologies using the same fuel as already installed. A third segment, the remaining 62 percent of floorspace, is constrained to consider only different efficiency levels of the same fuel and technology already installed. For lighting and refrigeration, all replacement choices are limited to the same technology class, where technologies are broadly defined to encompass the principal competing technologies for a particular application. For example, a commercial ice maker may replace another ice maker, but may not replace a refrigerated vending machine. When computing annualized costs to determine equipment choices, commercial floorspace is segmented by what are referred to as hurdle rates or implicit discount rates (to distinguish them from the generally lower and more common notion of financial discount rates). Seven segments are used to simulate consumer behavior when purchasing commercial equipment. The segments range from rates as low as the 10-year Treasury bond rate to rates high enough to guarantee that only equipment with the lowest capital cost (and least efficiency) is chosen. As real energy prices increase (decrease) there is an incentive for all but the highest implicit discount rate segments to purchase increased (decreased) levels of efficiency. The equipment choice submodule is designed to choose among a discrete set of technologies that are characterized by a menu which defines availability, capital costs, maintenance costs, efficiencies, and equipment life. Technology characteristics for selected space heating equipment are shown in Table 4 below, derived from the report Assumptions to the Annual Energy Outlook 200913 This menu of equipment includes technological innovation, market developments, and policy interventions. For the AEO2009, the technology types that are included for seven of the ten service demand categories are listed in Table 5 below. The remaining three end-use services (PC-related office equipment, other
office equipment, and other end uses) are considered minor services and
are projected using exogenous equipment efficiency and market penetration
trends. |
||||||||||||||
|
||||||||||||||
| Energy Consumption Submodule | back to top | |||||||||||||
Once the required equipment choices have been made, the total stock and efficiency of equipment for a particular end use are determined. Energy consumption by fuel can be calculated from the amount of service demand satisfied by each technology and the corresponding efficiency of the technology. At this stage, adjustments to energy consumption are also made. These include adjustments for changes in real energy prices (short-run price elasticity effects), adjustments in utilization rates caused by efficiency increases (efficiency rebound effects), and changes for weather relative to the CBECS survey year. Once these modifications are made, total energy use is computed across end uses and building types for the three major fuels, for each Census division. Combining these projections with the econometric/trend projections for the five minor fuels yields total projected commercial energy consumption. |
||||||||||||||
|
||||||||||||||
|
||||||||||||||