Vermont Quick Facts
- In 2021, Vermont consumed 3.4 times more energy than it produced, but its total energy consumption was less than in any other state, which contributed to Vermont having the lowest energy-related carbon dioxide emissions among the states.
- About 57% of Vermont households heat with petroleum products, the third-largest share among the states, and 13% use wood, the highest share in any state. More than one-third of Vermont schoolchildren attend facilities heated by wood products.
- In 2022, Vermont generated almost 100% of its electricity from renewable resources, a larger share than in any other state. About 52% of Vermont's utility-scale in-state electricity generation and 48% of the state's total generation came from conventional hydroelectric power.
- In 2022, Vermont’s five utility-scale wind farms accounted for about 17% of the state’s total electricity net generation, a larger share than in nearly three-fourths of the states.
- Vermont’s Comprehensive Energy Plan (CEP) has set overall goals to meet 25% of the state’s energy needs through renewable sources by 2025, 45% by 2035, and 90% by 2050. The CEP sets specific goals for the transportation, heating, and electric power sectors.
Last Updated: November 16, 2023
Data
Last Update: July 18, 2024 | Next Update: August 15, 2024
| Prices | |||||
|---|---|---|---|---|---|
| Petroleum | Vermont | U.S. Average | Period | find more | |
| Domestic Crude Oil First Purchase | -- | $ 83.16 /barrel | Apr-24 | ||
| Natural Gas | Vermont | U.S. Average | Period | find more | |
| City Gate | $ 4.13 /thousand cu ft | $ 3.43 /thousand cu ft | Apr-24 | find more | |
| Residential | $ 15.97 /thousand cu ft | $ 14.93 /thousand cu ft | Apr-24 | find more | |
| Coal | Vermont | U.S. Average | Period | find more | |
| Average Sales Price | -- | $ 54.46 /short ton | 2022 | ||
| Delivered to Electric Power Sector | -- | $ 2.54 /million Btu | Apr-24 | ||
| Electricity | Vermont | U.S. Average | Period | find more | |
| Residential | 21.85 cents/kWh | 16.88 cents/kWh | Apr-24 | find more | |
| Commercial | 18.65 cents/kWh | 12.66 cents/kWh | Apr-24 | find more | |
| Industrial | 11.30 cents/kWh | 7.82 cents/kWh | Apr-24 | find more | |
| Reserves | |||||
|---|---|---|---|---|---|
| Reserves | Vermont | Share of U.S. | Period | find more | |
| Crude Oil (as of Dec. 31) | -- | -- | 2022 | find more | |
| Expected Future Production of Dry Natural Gas (as of Dec. 31) | -- | -- | 2022 | find more | |
| Expected Future Production of Natural Gas Plant Liquids | -- | -- | 2022 | find more | |
| Recoverable Coal at Producing Mines | -- | -- | 2022 | find more | |
| Rotary Rigs & Wells | Vermont | Share of U.S. | Period | find more | |
| Natural Gas Producing Wells | -- | -- | 2020 | find more | |
| Capacity | Vermont | Share of U.S. | Period | ||
| Crude Oil Refinery Capacity (as of Jan. 1) | -- | -- | 2023 | ||
| Electric Power Industry Net Summer Capacity | 857 MW | 0.1% | Apr-24 | ||
| Supply & Distribution | |||||
|---|---|---|---|---|---|
| Production | Vermont | Share of U.S. | Period | find more | |
| Total Energy | 28 trillion Btu | * | 2022 | find more | |
| Crude Oil | -- | -- | Apr-24 | find more | |
| Natural Gas - Marketed | -- | -- | 2022 | find more | |
| Coal | -- | -- | 2022 | find more | |
| Total Utility-Scale Net Electricity Generation | Vermont | Share of U.S. | Period | find more | |
| Total Net Electricity Generation | 184 thousand MWh | 0.1% | Apr-24 | ||
| Utility-Scale Net Electricity Generation (share of total) | Vermont | U.S. Average | Period | ||
| Petroleum-Fired | NM | 0.3 % | Apr-24 | find more | |
| Natural Gas-Fired | * | 39.5 % | Apr-24 | find more | |
| Coal-Fired | 0.0 % | 12.0 % | Apr-24 | find more | |
| Nuclear | 0.0 % | 18.5 % | Apr-24 | find more | |
| Renewables | 100.0 % | 29.3 % | Apr-24 | ||
| Stocks | Vermont | Share of U.S. | Period | find more | |
| Motor Gasoline (Excludes Pipelines) | -- | -- | Apr-24 | ||
| Distillate Fuel Oil (Excludes Pipelines) | 18 thousand barrels | * | Apr-24 | find more | |
| Natural Gas in Underground Storage | -- | -- | Apr-24 | find more | |
| Petroleum Stocks at Electric Power Producers | NM | NM | Apr-24 | find more | |
| Coal Stocks at Electric Power Producers | 0 thousand tons | 0.0% | Apr-24 | find more | |
| Fueling Stations | Vermont | Share of U.S. | Period | ||
| Motor Gasoline | 398 stations | 0.4% | 2021 | ||
| Propane | 2 stations | 0.1% | Jun-24 | ||
| Electric Vehicle Charging Locations | 399 stations | 0.6% | Jun-24 | ||
| E85 | 0 stations | 0.0% | Jun-24 | ||
| Biodiesel, Compressed Natural Gas, and Other Alternative Fuels | 3 stations | 0.1% | Jun-24 | ||
| Consumption & Expenditures | |||||
|---|---|---|---|---|---|
| Summary | Vermont | U.S. Rank | Period | ||
| Total Consumption | 125 trillion Btu | 51 | 2022 | find more | |
| Total Consumption per Capita | 280 million Btu | 27 | 2022 | find more | |
| Total Expenditures | $ 3,580 million | 50 | 2022 | find more | |
| Total Expenditures per Capita | $ 4,889 | 32 | 2022 | find more | |
| by End-Use Sector | Vermont | Share of U.S. | Period | ||
| Consumption | |||||
| » Residential | 41 trillion Btu | 0.2% | 2022 | find more | |
| » Commercial | 25 trillion Btu | 0.2% | 2022 | find more | |
| » Industrial | 16 trillion Btu | 0.1% | 2022 | find more | |
| » Transportation | 42 trillion Btu | 0.2% | 2022 | find more | |
| Expenditures | |||||
| » Residential | $ 1,092 million | 0.3% | 2022 | find more | |
| » Commercial | $ 627 million | 0.3% | 2022 | find more | |
| » Industrial | $ 389 million | 0.1% | 2022 | find more | |
| » Transportation | $ 1,472 million | 0.2% | 2022 | find more | |
| by Source | Vermont | Share of U.S. | Period | ||
| Consumption | |||||
| » Petroleum | 14 million barrels | 0.2% | 2022 | find more | |
| » Natural Gas | 13 billion cu ft | * | 2022 | find more | |
| » Coal | 0 thousand short tons | 0.0% | 2022 | find more | |
| Expenditures | |||||
| » Petroleum | $ 2,416 million | 0.2% | 2022 | find more | |
| » Natural Gas | $ 140 million | 0.1% | 2022 | find more | |
| » Coal | -- | -- | 2022 | find more | |
| Consumption for Electricity Generation | Vermont | Share of U.S. | Period | find more | |
| Petroleum | NM | NM | Apr-24 | find more | |
| Natural Gas | 0 million cu ft | 0.0% | Apr-24 | find more | |
| Coal | 0 thousand tons | 0.0% | Apr-24 | find more | |
| Energy Source Used for Home Heating (share of households) | Vermont | U.S. Average | Period | ||
| Natural Gas | 18.1 % | 46.2 % | 2022 | ||
| Fuel Oil | 38.2 % | 3.9 % | 2022 | ||
| Electricity | 8.7 % | 41.3 % | 2022 | ||
| Propane | 18.6 % | 5.0 % | 2022 | ||
| Other/None | 16.4 % | 3.5 % | 2022 | ||
| Environment | |||||
|---|---|---|---|---|---|
| Renewable Energy Capacity | Vermont | Share of U.S. | Period | find more | |
| Total Renewable Energy Electricity Net Summer Capacity | 710 MW | 0.2% | Apr-24 | ||
| Ethanol Plant Nameplate Capacity | -- | -- | 2023 | ||
| Renewable Energy Production | Vermont | Share of U.S. | Period | find more | |
| Utility-Scale Hydroelectric Net Electricity Generation | 97 thousand MWh | 0.5% | Apr-24 | ||
| Utility-Scale Solar, Wind, and Geothermal Net Electricity Generation | 81 thousand MWh | 0.1% | Apr-24 | ||
| Utility-Scale Biomass Net Electricity Generation | 30 thousand MWh | 0.8% | Apr-24 | ||
| Small-Scale Solar Photovoltaic Generation | 25 thousand MWh | 0.3% | Apr-24 | ||
| Fuel Ethanol Production | 0 thousand barrels | 0.0% | 2022 | ||
| Renewable Energy Consumption | Vermont | U.S. Rank | Period | find more | |
| Renewable Energy Consumption as a Share of State Total | 24.5 % | 6 | 2022 | ||
| Fuel Ethanol Consumption | 664 thousand barrels | 49 | 2022 | ||
| Total Emissions | Vermont | Share of U.S. | Period | find more | |
| Carbon Dioxide | 5.6 million metric tons | 0.1% | 2021 | ||
| Electric Power Industry Emissions | Vermont | Share of U.S. | Period | find more | |
| Carbon Dioxide | 13 thousand metric tons | * | 2022 | ||
| Sulfur Dioxide | 0 thousand metric tons | 0.0% | 2022 | ||
| Nitrogen Oxide | 1 thousand metric tons | 0.1% | 2022 | ||
Analysis
Last Updated: November 16, 2023
Overview
Vermont's forest-covered mountains and fast-running rivers are home to substantial renewable energy resources, but the state has no fossil energy reserves.1,2,3 Less than 100 miles across at its widest, Vermont lies between the shores of the Connecticut River on its eastern border with New Hampshire and Lake Champlain and the Hudson River Valley on its western border with New York. The mountains that run the length of Vermont, from Canada in the north to the hills of Massachusetts in the south, occupy most of the state and have Vermont's greatest wind energy resources.4,5,6 Rivers that descend from the mountains and those that border the state provide hydroelectric resources.7 Forests that cover almost four-fifths of Vermont support the state's wood products industry, whose byproducts also fuel electricity generation and provide home heating.8,9 More than one in eight Vermont households use wood for their primary heating source, almost 10 times more than the national average and the largest share of any state.10
Vermont consumes less energy than any other state but produces only three-tenths of the total energy it needs.
Vermont is the second-smallest state by population, after Wyoming, and the eighth-smallest state by area.11,12 More than one-fourth of Vermont's residents live along Lake Champlain in the northwestern county that includes the city of Burlington.13 Most other Vermonters live in small towns and on farms. Based on the percentage of its population that lives in rural census districts, Vermont is one of the two most rural states in the nation.14 In part because of the state's small population, Vermonters use less total energy than the residents of any other state in the nation, and their total energy consumption per capita is among the lowest one-sixth of states.15,16 However, Vermont produces only three-tenths of the total energy it needs.17 The residential sector, with its high heating requirements during the state's frigid winters, is the largest energy consumer in the state. That sector accounts for almost 34% of Vermont's energy consumption, even though about one in seven Vermont homes are occupied only seasonally.18,19 The transportation sector follows at 33% of state energy consumption. The commercial sector uses more than 20%. The industrial sector, which includes the manufacture of electrical components, food production, and agriculture, accounts for 13%.20,21
Electricity
Vermont's in-state electricity net generation has come almost entirely from renewable resources since the permanent shutdown of the Vermont Yankee Nuclear Power Station at the end of 2014.22,23 Prior to its shutdown, Vermont Yankee alone accounted for about half of the state's generating capacity and typically supplied between 70% and 80% of the state's net generation.24 More than half of Vermont's electricity supply now comes from out of state.25 In 2022, Vermont produced only about 44% of the electricity it consumed.26,27 The largest share of the state's electricity comes from hydroelectric power, most of it generated in Canada.28
In 2022, the largest share of the Vermont's in-state electricity generation also came from hydroelectric power. Biomass, solar, and wind supplied almost all the rest. Solar energy's contribution has increased rapidly. In 2021, solar surpassed wind's contribution for the first time, and solar energy provided more power than wind again in 2022. Batteries that stored solar generation also provided a small amount of power. Natural gas and petroleum are used when needed for grid reliability and when demand is high. They fueled minor amounts of Vermont's in-state generation in 2022.29
Vermont is a member of the 11-state Regional Greenhouse Gas Initiative (RGGI), which was established to cap and reduce greenhouse gas emissions from power generation.30 In part because Vermont is one of only six states that do not have any utility-scale coal-fired electricity generation, the state has the lowest carbon dioxide emissions of any state in the nation.31,32 Proceeds from the sale of RGGI carbon allowances help fund state energy efficiency programs that provide energy efficiency services to consumers.33,34
More than half of Vermont’s electricity supply comes from out of state.
In 2021, Vermont ranked 10th-lowest among the states in per capita electricity retail sales and in residential per capita electricity retail sales. However, Vermont ranks lowest in the nation in total electricity retail sales, in part because of its small size.35 Although only about 1 in 10 Vermont households use electricity as their primary home heating source and a similar proportion use air conditioning, the residential sector accounts for two-fifths of the state's electricity consumption.36,37 The commercial sector uses more than one-third, and the industrial sector purchases one-fourth.38 Vermont's average electricity price is the 10th-highest in the nation.39
Vermont is the only New England state that has not restructured its electricity industry to allow retail competition. The state has 17 electricity distribution companies. There is 1 investor-owned distribution utility, 14 municipal utilities, and 2 rural electric cooperatives.40 In 1956, Vermont's electric utilities pooled their transmission systems to connect with hydroelectric generators in New York and Canada, creating the nation's first statewide transmission-only company.41 That company represents the state's utilities in power pool matters with the New England regional transmission operator, Independent System Operator—New England (ISO-NE). ISO-NE is responsible for managing reliable electricity flow across the six New England states. 42
Renewable energy
Vermont has the largest share of in-state electricity net generation from renewable resources of any state, reaching between 99% and 100% in every year since 2015.43 About 43% of Vermont's total electricity net generation comes from the 47 hydroelectric plants at dams around the state.44 Biomass, almost entirely from wood and wood waste, accounts for 20% of Vermont's total net generation.45 In addition to the about one in eight Vermont households that rely on wood for heat, more than one-third of Vermont children attend a school heated by wood.46,47 Vermont's biomass resources also provide feedstock to the state's one wood pellet manufacturing plant, which has a production capacity of about 12,000 tons per year.48
Renewable resources provided about 100% of Vermont’s in-state electricity generation in 2022, the largest share for any state.
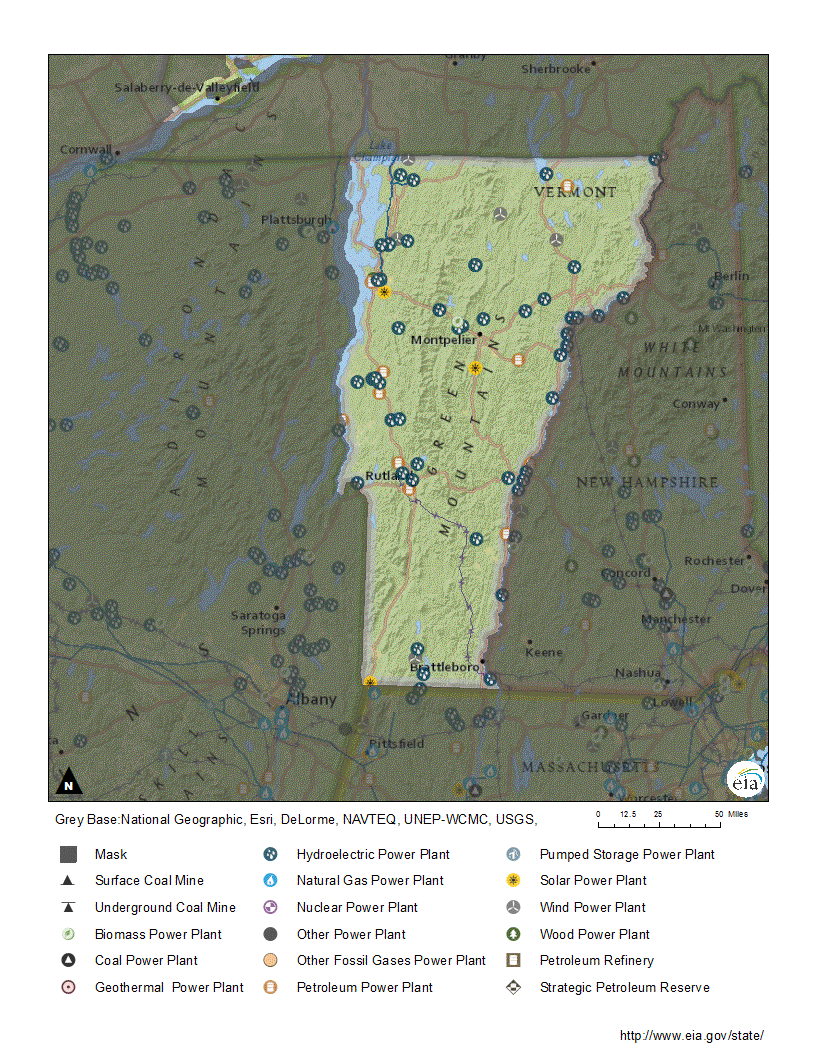
In 2022, solar energy at utility-scale and small-scale installations accounted for 18% of Vermont's total in-state generation.49 By August 2023, Vermont had about 314 megawatts of solar capacity installed at large- and small-scale sites across the state.50 The state's largest solar farm, with almost 20 megawatts of generating capacity, began operating in December 2018. Additional solar projects are in development, including a 20-megawatt solar farm that is schedule to come online at the end of 2024.51,52 In 2022, Vermont's five utility-scale wind farms also contributed about 18% of the state's total net generation.53,54 Two of Vermont's commercial wind farms are on mountain crests near the state's southern border. The others, including the state's largest, are located in northern Vermont.55 The state's utility-scale wind facilities have about 150 megawatts of combined capacity.56 There are also a number of small-scale, but more than 100-kilowatt, wind facilities in northern Vermont.57
Vermont enacted a renewable energy standard (RES) in 2015. The standard integrated increasing renewable energy production with reducing total energy use and costs. The RES requires that the state's retail electricity suppliers obtain 75% of their annual electricity sales from eligible renewable sources by 2032 including a 10% carve-out for new, in-state, renewable generation at customer-sited facilities with capacities of 5 megawatts or less. Municipal utilities with 6,000 or fewer customers have a lesser requirement. The Vermont RES also requires that retail electricity suppliers help consumers reduce their total fossil fuel use in applications that are not used for electricity generation, like home weatherization, geothermal heat pumps, high-efficiency heating systems, biomass heating systems, demand management strategies, electric vehicles, and battery storage of electricity generated by renewable sources.58 Vermont's overall energy goals are to meet 25% of all the state's energy needs from renewable sources by 2025, 45% by 2035, and 90% by 2050.59 In 2021, renewables accounted for almost one third of all energy consumed in the state.60 Vermont allows net metering of up to 500 kilowatts of capacity from customer-sited installations that use renewable resources. State regulations limit net metering of combined heat and power (CHP) systems that use non-renewable fuels to 20 kilowatts and requires that they meet efficiency standards. Vermont does not have a cap on how much of an electricity supplier's peak demand can be net-metered.61
Petroleum
Petroleum, consumed primarily for transportation and home heating, accounts almost three-fifths of Vermont’s energy use.
Vermont has no crude oil reserves or production, nor does it have any petroleum refineries.62 Although there are no petroleum product pipelines in the state, there is a petroleum product terminal in the Burlington area.63 Refined products arrive by rail and truck from neighboring states and Canada.64 One rarely used crude oil pipeline crosses Vermont, but it makes no deliveries in the state.65
In 2021, about 56% of the energy consumed in Vermont was petroleum-based.66 Although the state uses less petroleum than all the other states, Vermont uses more petroleum per capita than almost two-thirds of the states.67 Vermont's transportation sector consumes the largest share, accounting for almost three-fifths of the state's total petroleum use.68 Vermont has identified strategies to reduce petroleum consumption in the transportation sector, including increased vehicle efficiency, increased use of alternative-fueled vehicles, and land-use planning that reduces the need for automobiles.69 By autumn 2023, there were 364 public access electric vehicle charging stations available statewide with 906 all-electric vehicle charging ports.70 The residential sector accounts for nearly one-fourth of Vermont's petroleum consumption.71 Almost three in five Vermont households use fuel oil, kerosene, or propane to heat their homes, a larger share than in all other states except Maine and New Hampshire.72 As a result, the state is particularly vulnerable to heating oil shortages and price spikes during the winter months. The U.S. Department of Energy's Northeast Home Heating Oil Reserve—created in 2000 to respond to heating fuel supply disruptions in the region—holds 1 million barrels of ultra-low sulfur heating oil at three storage sites, one each in Massachusetts, Connecticut, and New Jersey.73 The commercial and industrial sectors use almost all the rest of the petroleum consumed in Vermont, and together they accounted for one-fifth of the state's total petroleum consumption in 2021. The electric power sector intermittently uses a very small amount of petroleum.74
Natural gas
Vermont has no natural gas reserves or production.75 Vermont's single natural gas utility receives its supply from a small-capacity pipeline that brings natural gas south from Canada. The company is committed to reducing greenhouse gas emissions by 30% in the next 10 years through increased use of renewable natural gas.76 The utility distributes natural gas in the counties along Lake Champlain down to the Burlington area.77 A 41-mile expansion of natural gas service into Addison County south of Burlington was completed in 2017.78 The northwestern part of the state remains the only area with access to natural gas service. As a result, Vermont is the nation's second-smallest total natural gas consumer and the second-smallest natural gas consumer on a per capita basis among the states. Only Hawaii uses less natural gas.79
Vermont's commercial sector accounts for more than half the natural gas consumed in the state, and the residential sector uses almost three-tenths.80 Because much of the state's population lives in the Greater Burlington area, nearly one in five Vermont households rely on natural gas for their primary home heating fuel.81,82 The industrial sector consumes most of the rest. The transportation sector uses very small amounts of natural gas as vehicle fuel.83 The state has three compressed natural gas vehicle fueling stations, all located in the Burlington area, and only one is public-access.84 The only natural gas used in the electric power sector is consumed as a secondary energy source at a biomass-fueled power plant and at a natural gas and biomass-fueled combined heat and power plant.85,86
Coal
Vermont does not have any coal mines or coal reserves.87 There are no coal-fired power plants in the state and Vermont was one of only six states that had no coal-fired electricity generation in 2022, which contributes to Vermont having the lowest energy-related carbon dioxide emissions among the states.88,89 Vermont is part of the six-state ISO-NE regional grid, which receives a decreasing share of its power from coal-fired power plants. In 2022, ISO-NE received only 0.3% of its electricity supply from coal-fired power plants, down from 18% in 2000. However, ISO-NE remains dependent on out-of-state coal-fired facilities during periods of peak electricity demand.90
Endnotes
1 Roberts, Billy J., Forest Residues in the United States, National Renewable Energy Laboratory (January 15, 2014).
2 Samu, N.M., et al., The 2020 National Hydropower Map, Oak Ridge National Laboratory, accessed October 20, 2023.
3 U.S. Energy Information Administration (EIA), Vermont, Profile Data, Reserves, and Environment, accessed October 20, 2023.
4 NETSTATE, Vermont, Vermont Almanac, updated March 9, 2018.
5 Morrissey, Charles Thomas, Vermont, Land, Relief, Britannica, accessed October 20, 2023.
6 U.S. Department of Energy, Energy Efficiency and Renewable Energy, WINDExchange, Wind Energy in Vermont, accessed October 20, 2023.
7 Vermont Agency of Natural Resources, Department of Environmental Conservation, Hydroelectric Power, accessed October 20, 2023.
8 Vermont Agency of Natural Resources, Department of Forests, Parks and Recreation, Overview of Vermont's Forests, accessed October 20, 2023.
9 U.S. EIA, Electricity Data Browser, Net generation for all sectors, Vermont, All fuels, Wood and wood-derived fuels, Annual, 2021-22.
10 U.S. Census Bureau, Vermont, United States, All states within the United States, Table B25040, House Heating Fuel, 2022, American Community Survey 1-Year Estimates.
11 U.S. Census Bureau, State Population Totals and Components of Change: 2020-2022, Annual Estimates of the Resident Population for the United States, Regions, States, the District of Columbia, and Puerto Rico: April 1, 2020 to July 1, 2022.
12 U.S. Census Bureau, Vermont, accessed October 20, 2023.
13 U.S. Census Bureau, County Population Totals: 2020-2022, Annual Estimates of the Resident Population for Counties: April 1, 2020 to July 1, 2021 (CO-EST2022-POP), Vermont.
14 Vermont Tax Structure Commission, Population Changes and Vermont State Revenue (December 6, 2019), p. 12.
15 U.S. EIA, State Energy Data System, Table F35, Total Energy Consumption, Price, and Expenditure Estimates, 2021.
16 U.S. EIA, State Energy Data System, Rankings: Total Energy Consumed per Capita, 2021.
17 U.S. EIA, State Energy Data System, Table P3, Energy Production and Consumption Estimates in Trillion Btu, 2021.
18 Dupigny-Giroux, Lesley-Ann, "Oh, the Maple Sweetness of Vermont's Climate," Community Collaborative Rain, Hail & Snow Network, CoCoRaHS State Climates Series, accessed October 20, 2023.
19 U.S. Census Bureau, Data, Vermont, Table B25002, Occupancy Status, 2022, and Vermont Table B25004, Vacancy Status, 2022, American Community Survey 1-Year Estimates.
20 U.S. EIA, State Energy Data System, Table F35, Total Energy Consumption, Price, and Expenditure Estimates, 2021.
21 NETSTATE, Vermont Economy, updated December 19, 2017.
22 U.S. Nuclear Regulatory Commission, Vermont Yankee Nuclear Power Station, updated March 9, 2021.
23 U.S. EIA, Electricity Data Browser, Net generation for all sectors, Vermont, Fuel Type-Check all, Annual, 2001-22.
24 U.S. EIA, Vermont Electricity Profile 2021, Table 4, Electric power industry capacity by primary energy source, 1990 through 2021, and Table 5, Electric power industry generation by primary energy source, 1990 through 2021.
25 U.S. EIA, Vermont Electricity Profile 2021, Table 10, Supply and disposition of electricity, 1990 through 2021.
26 U.S. EIA, Electricity Data Browser, Net generation for all sectors, Vermont, All fuels, Small-scale photovoltaic, Annual, 2022
27 U.S. EIA, Electricity Data Browser, Retail sales of electricity, Vermont, All sectors, 2022.
28 Vermont Department of Public Service, 2022 Vermont Comprehensive Energy Plan, p. 243.
29 U.S. EIA, Electricity Data Browser, Net generation for all sectors, Vermont, Fuel Type-Check all, Annual, 2020-22
30 Regional Greenhouse Gas Initiative, Elements of RGGI, accessed October 22, 2023.
31 U.S. EIA, Electric Power Monthly (February 2023), Table 1.4.B.
32 U.S. EIA, Rankings: Total Carbon Dioxide Emissions, 2021.
33 NC Clean Energy Technology Center, DSIRE, Efficiency Vermont, updated July 28, 2021.
34 Vermont Agency of Natural Resources, "Vermont receives record funding for state energy efficiency efforts," Press Release, accessed October 22, 2023.
35 U.S. EIA, State Energy Data System, Table C17, Electricity Retail Sales, Total and Residential, Total and per Capita, Ranked by State, 2021.
36 U.S. Census Bureau, Data, Vermont, Table B25040, House Heating Fuel, 2022 American Community Survey 1-Year Estimates.
37 U.S. EIA, Residential Energy Consumption Survey (RECS), 2020 RECS Survey Data, State Data, Consumption and expenditures, Table CE4.1EL.ST - Electricity by end use by state - totals, 2020.
38 U.S. EIA, Electricity Data Browser, Retail sales of electricity, Vermont, End-Use Sector, Check all, Annual 2022.
39 U.S. EIA, Electric Power Monthly (February 2023), Table 5.6.B.
40 Vermont Department of Public Service, Electric, Vermont Electric Utilities, accessed October 22, 2023.
41 Vermont Electric Power Company, About Vermont Electric Power Company, accessed October 22, 2023.
42 Vermont Electric Power Company, Who's who in Vermont's electric system, accessed October 22, 2023.
43 U.S. EIA, Electricity Data Browser, Net generation for all sectors, All states, All fuels, Conventional hydroelectric, Other resources, Small-scale solar photovoltaic, Annual, 2015-22.
44 U.S. EIA, Electricity, Preliminary Monthly Electric Generator Inventory (based on Form EIA-860M as a supplement to Form EIA-860), Inventory of Operating Generators as of September 2023.
45 U.S. EIA, Electricity Data Browser, Net generation for all sectors, Vermont, Fuel Type-Check all, Annual, 2022.
46 U.S. Census Bureau, Data, Vermont, Table B25040, House Heating Fuel, 2022 American Community Survey 1-Year Estimates.
47 Vermont Department of Public Service, 2016 Vermont Comprehensive Energy Plan, p. 324.
48 U.S. EIA, Monthly Densified Biomass Fuel Report (October 2023), Table 1, Densified biomass fuel manufacturing facilities in the United States by state, region, and capacity, July 2023.
49 U.S. EIA, Electricity Data Browser, Net generation for all sectors, Vermont, All fuels, All solar, Small-scale solar photovoltaic, Utility-scale solar photovoltaic, Annual, 2022.
50 U.S. EIA, Electric Power Monthly (October 2023), Tables 6.2.B.
51 U.S. EIA, Electricity, Preliminary Monthly Electric Generator Inventory (based on Form EIA-860M as a supplement to Form EIA-860), Inventory of Operating Generators as of September 2023 and Inventory of Planned Generators as of September 2023.
52 U.S. EIA, Electric Power Monthly (October 2023), Table 6.5.
53 U.S. EIA, Electricity, Preliminary Monthly Electric Generator Inventory (based on Form EIA-860M as a supplement to Form EIA-860), Inventory of Operating Generators as of September 2023.
54 U.S. EIA, Electricity Data Browser, Net generation for all sectors, Vermont, Fuel Type-Check all, Annual, 2022.
55 U.S. EIA, Vermont Profile Overview, Interactive GIS Data viewer, Wind Power Plant Map Layer, accessed October 24, 2023.
56 U.S. EIA, Electric Power Monthly (October 2023), Tables 6.2.B.
57 Vermont Department of Public Service, 2016 Vermont Comprehensive Energy Plan, p. 309,
58 NC Clean Energy Technology Center, DSIRE, Vermont, Renewable Energy Standard, updated August 29, 2023.
59 Vermont Department of Public Service, 2023 Annual Energy Report (January 15, 2023), p. 6.
60 U.S. EIA, State Energy Data System, Table C11, Total Energy Consumption Estimates by End-Use Sector, Ranked by State, 2021, and Table C12, Primary Energy Consumption Estimates by Source, Ranked by State, 2021.
61 NC Clean Energy Technology Center, DSIRE, Vermont, Net Metering, updated March 22, 2023.
62 U.S. EIA, Vermont Profile Data, Profile Data, Reserves and Supply & Distribution, accessed October 24, 2023.
63 U.S. EIA, Vermont Profile Overview, Interactive GIS Data Viewer, Petroleum Product Pipeline Map Layer, accessed October 24, 2023.
64 Global Companies, LLC, Global Burlington VT, accessed October 24, 2023.
65 Canada Energy Regulator, Pipeline Profiles: Montreal, Pipeline system and key points, updated December 2021.
66 U.S. EIA, State Energy Data System, Table C1, Energy Consumption Overview: Estimates by Energy Source and End-Use Sector, 2021.
67 U.S. EIA, State Energy Data System, Table C15, Petroleum Consumption, Total and per Capita, Ranked by State, 2021.
68 U.S. EIA, State Energy Data System, Table F16, Total Petroleum Consumption Estimates, 2021.
69 Vermont Department of Public Service, 2022 Vermont Comprehensive Energy Plan, Executive Summary, p. ES10-ES12.
70 U.S. EIA, Monthly Energy Review (October 2023), DOE/EIA-0035(2023/10), Appendix F, Electric Vehicle Charging Infrastructure, p. 260.
71 U.S. EIA, State Energy Data System, Table F16, Total Petroleum Consumption Estimates, 2021.
72 U.S. Census Bureau, Vermont, United States, All states within the United States, Table B25040, House Heating Fuel, 2022, American Community Survey 1-Year Estimates.
73 U.S. Department of Energy, Office of Fossil Energy, Northeast Home Heating Oil Reserve, History, and About NEHHOR, accessed October 24, 2023.
74 U.S. EIA, State Energy Data System, Table F16, Total Petroleum Consumption Estimates, 2021.
75 U.S. EIA, Vermont Profile Data, Profile Data, Reserves and Supply & Distribution, accessed October 25, 2023.
76 Vermont Gas Systems, Inc., VGS's Approach to Climate, accessed October 25, 2023.
77 Vermont Public Service Commission, Natural Gas, and Coverage Map, accessed October 25, 2023.
78 Parent, Beth, "Vermont Gas Completes 41-Mile Expansion, Begins Serving Customers in Addison County," Vermont Gas Press Release (April 12, 2017).
79 U.S. EIA, State Energy Data System, Table C16, Natural Gas Consumption, Total and per Capita, Ranked by State, 2021.
80 U.S. EIA, Natural Gas Consumption by End Use, Vermont, 2017-22.
81 Vermont Center for Geographic Information, 2020 Census Data (August 12, 2021).
82 U.S. Census Bureau, Data, Vermont, Table B25040, House Heating Fuel, 2022 American Community Survey 1-Year Estimates.
83 U.S. EIA, Natural Gas Consumption by End Use, Vermont, 2017-22.
84 U.S. Department of Energy, Office of Energy Efficiency and Renewable Energy, Alternative Fuels Data Center, Alternative Fueling Station Locator, Advanced Filters, Vermont, Compressed Natural Gas (CNG), Public & private access, accessed October 25, 2023.
85 U.S. EIA, Electricity Data Browser, List of plants for natural gas, Vermont, all sectors, 2022.
86 U.S. EIA, Natural Gas Consumption by End Use, Vermont, 2017-22.
87 U.S. EIA, Annual Coal Report 2022 (October 2023), Tables 1, 15.
88 U.S. EIA, Electric Power Monthly (February 2023), Table 1.4.B.
89 U.S. EIA, Rankings: Total Carbon Dioxide Emissions, 2021.
90 ISO New England, New England Power Grid 2022-2023 Profile (February 2023).
Other Resources
Energy-Related Regions and Organizations
- Petroleum Administration for Defense District (PADD): 1A
- Regional Transmission Organization (RTO) and Independent System Operator (ISO): ISO New England (ISO-NE)
- North American Electric Reliability Corporation (NERC) ERO Enterprise: Regional Entities: Northeast Power Coordinating Council (NPCC)
Other Websites
- Vermont Public Utility Commission
- Vermont Department of Public Service, Electric
- Vermont Department of Public Service, Renewables
- Vermont Department of Public Service, Efficiency
- Vermont Department for Children and Families, Fuel Assistance
- Vermont Department for Children and Families, Weatherization Program
- Vermont Economic Development Authority, Energy Financing
- Vermont Office of the Governor, Natural Gas and Oil Resources Board
- Vermont Office of the Governor, Natural Resources Board
- Vermont Agency of Commerce and Community Development, Electric Vehicle Supply Equipment (EVSE) Grant Program
- EIA Vermont Flickr Album
- Vermont Department of Public Service
- Alternative Fuels Data Center, Federal and State Laws and Incentives
- Benefits.Gov, Housing and Public Utilities
- NC Clean Energy Technology Center, Database of State Incentives for Renewables and Efficiency (DSIRE)
- National Association of Regulatory Utility Commissioners (NARUC)
- National Association of State Energy Officials (NASEO)
- National Conference of State Legislatures (NCSL), Research and Policy
- National Renewable Energy Laboratory (NREL), Geospatial Data Science Data and Tools
- U.S. Geological Survey (USGS), Publications
- U.S. Department of Health & Human Services, Office of Community Services, An Office of the Administration for Children & Families, Low Income Home Energy Assistance Program (LIHEAP)
- U.S. Geological Survey, Maps
- Lawrence Livermore National Laboratory, Energy Flow Charts
- National Renewable Energy Laboratory, State and Local Planning for Energy (SLOPE)
- EIA New England Dashboard
- The Regional Greenhouse Gas Initiative
- EIA Natural Gas Storage Dashboard
- EIA Energy Disruptions
- U.S. Department of Agriculture (USDA), Rural Development, Energy Programs