New York Quick Facts
- New York law requires 70% renewable electricity by 2030 and 100% carbon-free electricity from both renewable sources and nuclear energy by 2040. In 2022, renewable sources and nuclear power combined supplied 51% of New York's total in-state generation from utility-scale and small-scale facilities.
- Nuclear power accounted for 21% of New York's utility-scale net generation in 2022, down from 34% in 2019 because the Indian Point nuclear power plant, one of the state's four nuclear power plants, shut down. The last two reactors at the Indian Point plant shutdown in 2020 and 2021.
- In 2022, New York accounted for 11% of U.S. hydroelectricity net generation, and the state was the third-largest producer of hydropower in the nation, after Washington and Oregon.
- New York consumes less total energy per capita than the residents in all but one other state, and per capita energy consumption in New York’s transportation sector is lower than in all other states.
- New York’s per capita energy-related carbon dioxide emissions are consistently lower than those of any other state in the nation.
Last Updated: December 21, 2023
Data
Last Update: April 18, 2024 | Next Update: May 16, 2024
| Prices | |||||
|---|---|---|---|---|---|
| Petroleum | New York | U.S. Average | Period | find more | |
| Domestic Crude Oil First Purchase | W | $ 72.26 /barrel | Jan-24 | ||
| Natural Gas | New York | U.S. Average | Period | find more | |
| City Gate | $ 4.23 /thousand cu ft | $ 4.76 /thousand cu ft | Jan-24 | find more | |
| Residential | $ 14.55 /thousand cu ft | $ 11.82 /thousand cu ft | Jan-24 | find more | |
| Coal | New York | U.S. Average | Period | find more | |
| Average Sales Price | -- | $ 54.46 /short ton | 2022 | ||
| Delivered to Electric Power Sector | -- | $ 2.48 /million Btu | Jan-24 | ||
| Electricity | New York | U.S. Average | Period | find more | |
| Residential | 23.44 cents/kWh | 15.45 cents/kWh | Jan-24 | find more | |
| Commercial | 18.07 cents/kWh | 12.68 cents/kWh | Jan-24 | find more | |
| Industrial | 7.54 cents/kWh | 8.10 cents/kWh | Jan-24 | find more | |
| Reserves | |||||
|---|---|---|---|---|---|
| Reserves | New York | Share of U.S. | Period | find more | |
| Crude Oil (as of Dec. 31) | -- | -- | 2021 | find more | |
| Expected Future Production of Dry Natural Gas (as of Dec. 31) | 92 billion cu ft | * | 2021 | find more | |
| Expected Future Production of Natural Gas Plant Liquids | -- | -- | 2021 | find more | |
| Recoverable Coal at Producing Mines | -- | -- | 2022 | find more | |
| Rotary Rigs & Wells | New York | Share of U.S. | Period | find more | |
| Natural Gas Producing Wells | 6,372 wells | 1.3% | 2020 | find more | |
| Capacity | New York | Share of U.S. | Period | ||
| Crude Oil Refinery Capacity (as of Jan. 1) | 0 barrels/calendar day | 0.0% | 2023 | ||
| Electric Power Industry Net Summer Capacity | 40,104 MW | 3.4% | Jan-24 | ||
| Supply & Distribution | |||||
|---|---|---|---|---|---|
| Production | New York | Share of U.S. | Period | find more | |
| Total Energy | 761 trillion Btu | 0.8% | 2021 | find more | |
| Crude Oil | 1 thousand barrels per day | * | Jan-24 | find more | |
| Natural Gas - Marketed | 9,734 million cu ft | * | 2022 | find more | |
| Coal | -- | -- | 2022 | find more | |
| Total Utility-Scale Net Electricity Generation | New York | Share of U.S. | Period | find more | |
| Total Net Electricity Generation | 11,248 thousand MWh | 3.0% | Jan-24 | ||
| Utility-Scale Net Electricity Generation (share of total) | New York | U.S. Average | Period | ||
| Petroleum-Fired | 1.0 % | 0.4 % | Jan-24 | find more | |
| Natural Gas-Fired | 47.2 % | 42.2 % | Jan-24 | find more | |
| Coal-Fired | 0.0 % | 19.9 % | Jan-24 | find more | |
| Nuclear | 21.9 % | 18.2 % | Jan-24 | find more | |
| Renewables | 29.5 % | 18.8 % | Jan-24 | ||
| Stocks | New York | Share of U.S. | Period | find more | |
| Motor Gasoline (Excludes Pipelines) | 1 thousand barrels | * | Jan-24 | ||
| Distillate Fuel Oil (Excludes Pipelines) | 2,766 thousand barrels | 2.8% | Jan-24 | find more | |
| Natural Gas in Underground Storage | 186,633 million cu ft | 2.6% | Jan-24 | find more | |
| Petroleum Stocks at Electric Power Producers | 3,019 thousand barrels | 13.6% | Jan-24 | find more | |
| Coal Stocks at Electric Power Producers | 0 thousand tons | 0.0% | Jan-24 | find more | |
| Fueling Stations | New York | Share of U.S. | Period | ||
| Motor Gasoline | 4,676 stations | 4.2% | 2021 | ||
| Propane | 42 stations | 1.7% | Mar-24 | ||
| Electric Vehicle Charging Locations | 3,759 stations | 6.2% | Mar-24 | ||
| E85 | 70 stations | 1.6% | Mar-24 | ||
| Biodiesel, Compressed Natural Gas, and Other Alternative Fuels | 28 stations | 1.0% | Mar-24 | ||
| Consumption & Expenditures | |||||
|---|---|---|---|---|---|
| Summary | New York | U.S. Rank | Period | ||
| Total Consumption | 3,541 trillion Btu | 8 | 2021 | find more | |
| Total Consumption per Capita | 178 million Btu | 50 | 2021 | find more | |
| Total Expenditures | $ 59,525 million | 4 | 2021 | find more | |
| Total Expenditures per Capita | $ 2,998 | 51 | 2021 | find more | |
| by End-Use Sector | New York | Share of U.S. | Period | ||
| Consumption | |||||
| » Residential | 1,108 trillion Btu | 5.3% | 2021 | find more | |
| » Commercial | 1,045 trillion Btu | 6.0% | 2021 | find more | |
| » Industrial | 367 trillion Btu | 1.1% | 2021 | find more | |
| » Transportation | 1,021 trillion Btu | 3.8% | 2021 | find more | |
| Expenditures | |||||
| » Residential | $ 19,194 million | 6.8% | 2021 | find more | |
| » Commercial | $ 15,062 million | 7.6% | 2021 | find more | |
| » Industrial | $ 3,493 million | 1.5% | 2021 | find more | |
| » Transportation | $ 21,776 million | 3.6% | 2021 | find more | |
| by Source | New York | Share of U.S. | Period | ||
| Consumption | |||||
| » Petroleum | 237 million barrels | 3.3% | 2021 | find more | |
| » Natural Gas | 1,360 billion cu ft | 4.2% | 2022 | find more | |
| » Coal | 241 thousand short tons | * | 2022 | find more | |
| Expenditures | |||||
| » Petroleum | $ 27,373 million | 3.6% | 2021 | find more | |
| » Natural Gas | $ 15,122 million | 5.6% | 2022 | find more | |
| » Coal | $ 22 million | 0.1% | 2022 | find more | |
| Consumption for Electricity Generation | New York | Share of U.S. | Period | find more | |
| Petroleum | 209 thousand barrels | 7.5% | Jan-24 | find more | |
| Natural Gas | 41,222 million cu ft | 3.6% | Jan-24 | find more | |
| Coal | 0 thousand tons | 0.0% | Jan-24 | find more | |
| Energy Source Used for Home Heating (share of households) | New York | U.S. Average | Period | ||
| Natural Gas | 58.4 % | 46.2 % | 2022 | ||
| Fuel Oil | 16.5 % | 3.9 % | 2022 | ||
| Electricity | 15.3 % | 41.3 % | 2022 | ||
| Propane | 5.2 % | 5.0 % | 2022 | ||
| Other/None | 4.6 % | 3.5 % | 2022 | ||
| Environment | |||||
|---|---|---|---|---|---|
| Renewable Energy Capacity | New York | Share of U.S. | Period | find more | |
| Total Renewable Energy Electricity Net Summer Capacity | 9,386 MW | 2.8% | Jan-24 | ||
| Ethanol Plant Nameplate Capacity | 62 million gal/year | 0.4% | 2023 | ||
| Renewable Energy Production | New York | Share of U.S. | Period | find more | |
| Utility-Scale Hydroelectric Net Electricity Generation | 2,554 thousand MWh | 12.0% | Jan-24 | ||
| Utility-Scale Solar, Wind, and Geothermal Net Electricity Generation | 629 thousand MWh | 1.4% | Jan-24 | ||
| Utility-Scale Biomass Net Electricity Generation | 131 thousand MWh | 3.2% | Jan-24 | ||
| Small-Scale Solar Photovoltaic Generation | 226 thousand MWh | 4.7% | Jan-24 | ||
| Fuel Ethanol Production | 1,375 thousand barrels | 0.4% | 2021 | ||
| Renewable Energy Consumption | New York | U.S. Rank | Period | find more | |
| Renewable Energy Consumption as a Share of State Total | 13.4 % | 21 | 2021 | ||
| Fuel Ethanol Consumption | 12,897 thousand barrels | 4 | 2021 | ||
| Total Emissions | New York | Share of U.S. | Period | find more | |
| Carbon Dioxide | 156.0 million metric tons | 3.2% | 2021 | ||
| Electric Power Industry Emissions | New York | Share of U.S. | Period | find more | |
| Carbon Dioxide | 30,788 thousand metric tons | 1.9% | 2022 | ||
| Sulfur Dioxide | 8 thousand metric tons | 0.7% | 2022 | ||
| Nitrogen Oxide | 27 thousand metric tons | 2.2% | 2022 | ||
Analysis
Last Updated: December 21, 2023
Overview
New York consumes less total energy per capita than all but one other state.
New York is the nation's fourth-most populous state and has the country's third-largest economy.1,2 The state's largest metropolitan area, New York City, is the nation's financial hub and has been the U.S. city with the most residents in every census since 1790.3,4,5 Although more than two-fifths of the state's population lives in New York City, the state as a whole is less densely populated than six other states.6,7 New York is geographically diverse, and much of the state is rolling agricultural land and rugged mountains, including those in the Adirondack State Park, the largest state park in the nation at more than 6 million acres.8 New York is the nation's 27th largest state overall and eighth in the amount of its area that is covered by water.9 Portions of two of the Great Lakes—Lake Erie and Lake Ontario—are in the state. The Niagara River, with its massive falls, flows between those lakes and makes the state one of the nation's leading producers of hydroelectric power.10,11 The Great Lakes and Atlantic Ocean shorelines also have some of the state's best wind resources.12 Solar energy, primarily from small-scale installations, and biomass provide the state with additional renewable resources.13,14 New York produces a small amount of natural gas and crude oil.15,16 New York has one of the most energy-efficient economies in the nation, and New Yorkers consume less total energy per capita than all other states, except Rhode Island. However, the state depends on energy supplies from elsewhere to meet nearly four-fifths of its energy needs.17,18
Because New York is a Great Lakes State, its overall energy use increases during winter when arctic winds and lake-effect snows sweep in from Canada across the state's two Great Lakes.19,20 The residential sector accounts for more than three-tenths of state energy consumption, the commercial sector uses about three-tenths, and the transportation sector accounts for almost three-tenths.21 Per capita energy consumption in New York's transportation sector is lower than in all other states, in part because of the wide use of mass transportation in New York's densely populated urban areas.22 In 2022, more than one in five state residents used public transit to commute to work, seven times the national average.23,24 The industrial sector accounts for about one-tenth of state energy use, a smaller share than in all other states except Maryland and Connecticut. Many of New York's key economic activities, like finance, real estate, professional and business services, and government, are not energy-intensive industries.25,26
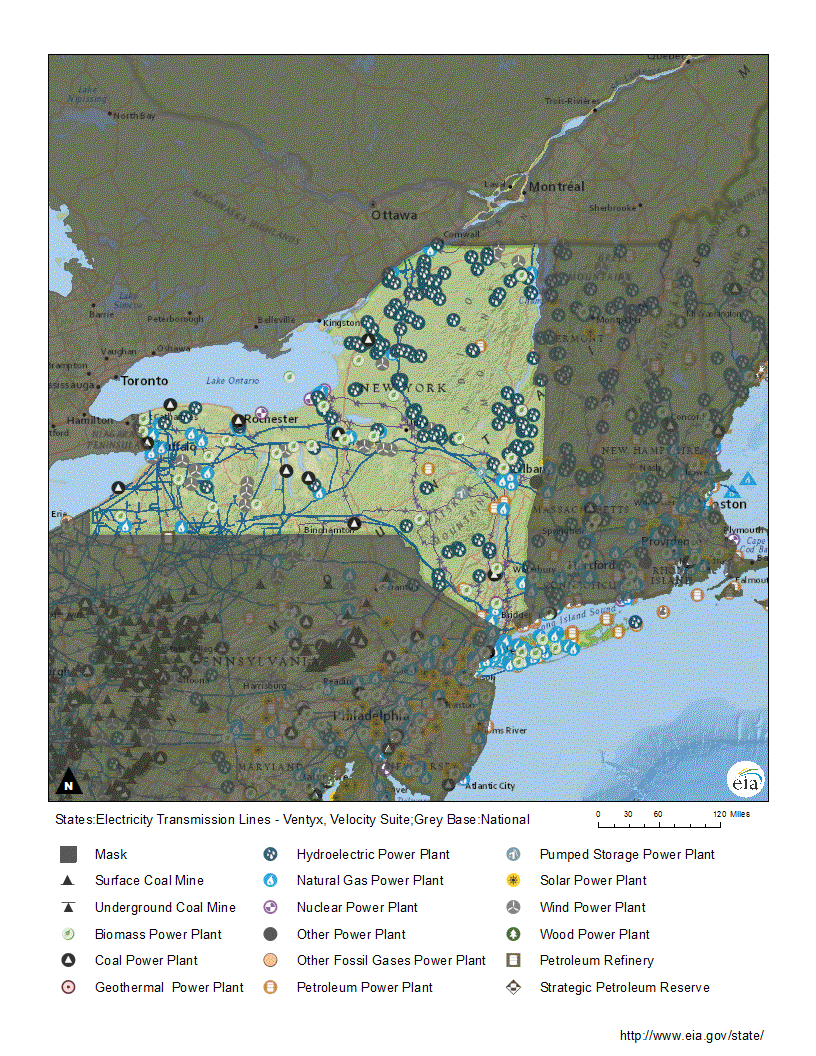
Electricity
Natural gas, hydropower, and nuclear energy have consistently generated more than 90% of New York’s electricity during the past decade.
Natural gas, hydropower, and nuclear energy have consistently generated more than 90% of New York's electricity during the past decade. Renewable resources, including solar energy, from both utility-scale (1 megawatt and larger) and small-scale (less than 1 megawatt) installations, as well as wind and biomass, provided almost all the rest of New York State's electricity net generation in 2022.27 Natural gas fuels 6 of the state's 10 largest power plants by capacity and 5 of the 10 largest by generation.28 In 2022, natural gas-fired power plants accounted for almost three-fifths of New York's generating capacity and 47% of New York's total electricity generation.29,30 To increase reliability, especially during the winter months when natural gas pipelines are highly congested, natural gas-fired electricity generating units with dual-fuel capability can switch fuels in the event of a natural gas supply disruption.31 In 2022, about two-thirds of the state's natural gas-fired capacity had dual-fuel capability, allowing them to also burn petroleum products.32,33
In 2022, renewable resources provided three-tenths of New York's total in-state electricity generation, most of it from hydroelectric plants.34 New York is among the nation's top four hydropower producers, and conventional hydroelectricity typically supplies between one-fifth and one-third of New York's in-state power generation.35 In 2022, hydropower provided more than 21% of the state's total generation, surpassing nuclear power for the first time, in large part because nuclear power's share of New York's in-state electricity generation declined when one of the state's four nuclear power plants closed.36 The state's remaining three nuclear power plants have about 3,300 megawatts of generating capacity, down from more than 5,350 megawatts four years earlier.37 In 2022, nuclear power supplied almost 21% of the state's electricity generation.38
Conventional hydroelectric power combined with other renewable resources, including small-scale solar power, wind, and biomass, have supplied a larger share of the state's total generation than nuclear power has in every year since 2020. In 2022, solar, wind, and biomass alone provided almost one-tenth of the state's total electricity generation.39 The amount of electricity generated at in-state utility-scale and small-scale (less than 1 megawatt) solar photovoltaic (PV) installations increased substantially during the past decade and exceeded the amount generated from biomass for the first time in 2019. In 2022, solar energy also accounted for a larger portion of the state's total generation than wind for the first time.40
Petroleum is used sparingly as a backup fuel at dual-fueled natural gas-fired electricity generating facilities. In 2022, petroleum fueled slightly more than 1% of the state's total net generation. Coal, which accounted for 16% of the state's electricity net generation two decades ago, no longer fuels any of New York's in-state net generation.41 The state's last coal-fired power plant closed in 2020.42 In 2022, New York was one of the six states that did not have any utility-scale coal-fired electricity generation.43
Electricity in New York State usually flows east and south toward the state's high-demand areas in the New York City and Long Island regions.44 The state typically needs more power than it generates, and New York receives additional electricity supply from neighboring states and Canada.45 However, per capita electricity consumption in New York is among the lowest in the nation; only Hawaii, California, and Rhode Island are lower.46 The commercial sector accounts for about half of the state's electricity consumption. The residential sector, where only one in seven households heat with electricity and about one in five have central air conditioning, uses more than one-third. The industrial sector consumes slightly more than one-tenth and the transportation sector uses the rest.47,48 In 2022, New York's transportation sector, which consists of its extensive public rail systems, accounted for about two-fifths of the nation's total transportation sector electricity use.49,50 The state also has almost 3,600 public access electric vehicle charging locations.51
Renewable energy
New York's 2,500-megawatt Robert Moses Niagara power plant is the nation’s third-largest conventional hydroelectric power plant.
New York generates more power from renewable resources than any other state east of the Mississippi River. In 2022, the state ranked seventh in the nation in renewable-sourced electricity generation from utility-scale (1 megawatt and larger) and small-scale (less than 1 megawatt) installations combined.52 About three-tenths of New York's total net generation, including small-scale facilities, was from renewable resources, most of it was provided by hydroelectric plants.53
New York is consistently among the nation's top four producers of hydroelectricity. In 2022, New York produced more hydroelectric power than all but two other states, Washington and Oregon, accounting for about 21% of New York's total in-state power generation.54,55 The 2,500-megawatt Robert Moses Niagara hydroelectric power plant at Lewiston near Niagara Falls produces the largest share of New York's hydropower. The plant is the third-largest conventional hydroelectric power plant by capacity and the fourth-largest hydropower plant of any kind in the United States.56,57 The associated Lewiston pumped-storage hydroelectric plant, with 12 pump turbines and a 1,900-acre storage reservoir, operates during periods of peak power demand to supplement power from the Robert Moses plant.58
In 2022, New York ranked third in the nation in electricity generation from small-scale solar.
Solar energy accounted for 4% of New York's total power generation in 2022. About two-thirds of the state's solar generation was from small-scale systems with capacities of less than 1 megawatt each.59 New York encourages small-scale solar photovoltaic (PV) installations, such as rooftop solar panels, with net metering and a variety of financial support programs.60 In 2022, the state ranked third in the nation in electricity generation from small-scale solar.61 There are also more than 400 utility-scale solar PV installations in New York, but most of them have capacities of less than 20 megawatts. However, there are 10 large solar facilities in the state with capacities of 20 megawatts or more.62 By September 2023, New York had about 4,400 megawatts of solar PV capacity at utility-scale and small-scale installations.63
New York's wind-powered electricity generation was surpassed by solar for the first time in 2022. Wind is now the state's third-largest source of renewable electricity generation. In 2022, wind accounted for 3.6% of New York's total net generation and about 12% of the state's electricity from renewables.64 As of September 2023, New York had more than 2,500 megawatts of wind capacity at 32 utility-scale wind farms.65,66 New York's additional onshore wind energy potential is located primarily at the eastern end of the state's Great Lakes, along the Long Island shoreline, and on the ridges in the Adirondack Mountains and the Catskill Mountains. However, the state's highest peaks are in state parks where wind development is restricted. New York also has offshore wind resources off Long Island and in the two Great Lakes.67 The state mandated the deployment of at least 9,000 megawatts of offshore wind capacity by 2035, and several offshore wind energy projects are in development, but some are facing economic challenges.68,69,70
Although biomass fueled only about 1.5% of New York's total net generation in 2022, the state ranked ninth in the amount of electricity generated from biomass.71,72 Municipal solid waste facilities account for almost three-fifths of the state's biomass-generating capacity. New York has many smaller landfill gas-fueled generators across the state, accounting for one-fourth of the state's biomass-generating capacity. New York's two utility-scale wood- and wood waste-fueled facilities account for about one-sixth of the state's biomass-generating capacity.73 However, in 2022, the wood-fueled power plants contributed almost three-tenths of the state's biomass-fueled generation.74 New York has other biomass and biofuel resources that are used for purposes other than electricity generation. The state has five wood pellet plants that have a combined manufacturing capacity of about 303,000 tons of pellets each year. Wood pellets are used for heating as well as for electricity generation.75
To reduce ozone formation, the New York City metropolitan area and Long Island require the use of reformulated motor gasoline blended with ethanol. The rest of the state uses a low-volatility motor gasoline blend.76 New York Harbor is the primary Northeast distribution hub for fuel ethanol supplies. Although some fuel ethanol is produced in New York, in 2021 the state consumed nine times more than it produced.77,78 New York's only fuel ethanol production plant has a capacity of about 62 million gallons per year.79 In 2021, the state consumed about 542 million gallons of fuel ethanol, the fourth-largest amount of any state.80 Typically, fuel ethanol produced in the Midwest and imports from overseas arrive through New York Harbor for distribution throughout the state and beyond. A large storage facility at Albany, New York, receives fuel ethanol by rail for distribution throughout the Northeast.81 New York does not have any biodiesel production, but the state was the nation's sixth-largest biodiesel consumer in 2021.82 Biodiesel consumption per capita, however, was less than in half of the states.83,84
New York adopted its first renewable portfolio standard (RPS) in 2004.85 In 2015, New York replaced its RPS with the state's Clean Energy Standard (CES). The CES required utilities and other electricity retail suppliers in the state to acquire 50% of the electricity they sold from clean energy resources by 2030. In July 2019, New York modified the CES with the Climate Leadership and Community Protection Act, which requires 70% renewable electricity by 2030 and 100% carbon-free electricity by 2040. The legislation also calls for 100% economy-wide net-zero carbon emissions by 2050. Existing nuclear power plants in the state are considered zero-emission resources. Facilities that are not technically capable of eliminating all carbon emissions can purchase carbon offsets to meet a portion of the required 100% net-zero goal. The offsets must be from nearby sources that reduce carbon, such as forests and agriculture.86,87 New York's per capita energy-related carbon dioxide emissions are consistently lower than those of any other state in the nation.88
Petroleum
New York is one of the nation’s largest petroleum consumers, but the state consumes less petroleum per capita than any other state.
Despite a long history of crude oil production, New York currently has no significant proved reserves and produces only a small amount of crude oil.89,90 In the 19th century, New York was an important crude oil production and processing center with more than 50 crude oil refineries, including one of the world's largest at the time. By the end of the 20th century, all the refineries in the state had closed. The small amount of crude oil currently produced in New York is shipped to out-of-state refineries.91,92
Crude oil refineries in New Jersey and Pennsylvania, refined product pipelines from the Gulf Coast and the Midwest, and imports, mostly from Canada, provide the petroleum products consumed in New York. New York Harbor, which includes terminals on both the New York and New Jersey shorelines, is the largest petroleum products hub in the Northeast, with bulk storage capacity exceeding 75 million barrels. Petroleum products delivered to the harbor are redistributed by truck or by barge to smaller ports on Long Island and upstate along the Hudson River. Western New York receives petroleum products from Pennsylvania and the Midwest through pipelines and from Canada through the Port of Buffalo.93
With its large population, New York is one of the nation's largest consumers of petroleum overall, but the state uses less petroleum per capita than any other state.94 The transportation sector uses more than three-fourths of the petroleum consumed in the state.95 In 2021, New York was the fourth-largest consumer of both motor gasoline and jet fuel, even though it had the second-lowest per capita transportation sector energy consumption among the states.96,97 New York also had the lowest per capita motor gasoline consumption of any state in large part because of the wide use of mass transportation.98,99 The residential sector accounts for about one-tenth of New York's petroleum consumption.100 About one in five New York households heat with petroleum products, primarily fuel oil.101 Because of concerns about home heating oil shortages in New York and other northeastern states, the federal government created the Northeast Home Heating Oil Reserve in 2000. In 2011, the U.S. Department of Energy announced plans to convert the reserve to ultra-low sulfur diesel (ULSD) containing a maximum of 15 parts per million of sulfur.102 In 2012, New York was the first northeastern state to require the use of ULSD.103 The industrial and commercial sectors account for the rest of the state's petroleum consumption. In 2021, the industrial sector and the commercial sector each accounted for about 6%.104
Natural gas
New York has few natural gas reserves, but it does have some production.105,106 The state's first commercial natural gas well was drilled in 1821.107 Annual production reached a recent annual high of almost 56 billion cubic feet in 2006, but in 2022 New York produced less than 10 billion cubic feet of natural gas.108 Most of the natural gas consumed in New York is produced in other states. The largest share comes through and from Pennsylvania.109 The Marcellus Shale, named for a town in central New York where the shale is visible at the surface, is a natural gas-bearing formation that extends under parts of New York, Pennsylvania, Ohio, West Virginia, and Maryland.110 It is the largest natural gas area in the United States as ranked by estimated proved reserves.111 Much of the Marcellus Shale gas is produced by hydraulic fracturing, commonly called fracking, a controversial technique used to produce natural gas from low permeability shales like the Marcellus. In 2014, New York's governor banned hydraulic fracturing, and in 2020, the state legislature made the fracking ban permanent.112,113 Only a few natural gas wells were drilled into New York's Marcellus Shale before the ban. As a result, the total amount of natural gas retrievable from the Marcellus Shale in New York is unknown.114,115
New York is the sixth-largest natural gas consumer among the states.
New York is the sixth-largest natural gas consumer among the states. However, New York consumes less natural gas per capita than almost three-fourths of the states.116 In 2022, natural gas fueled nearly half of the state's electricity generation, and 36% of the natural gas delivered to consumers in New York in 2022 went to the electric power sector.117 The residential sector, where three out of every five households heat with natural gas, accounted for 34% of the natural gas delivered to New York consumers.118 The commercial sector received 23% of the natural gas deliveries, and the industrial sector accounted for about 7%. The transportation sector used very little natural gas as vehicle fuel, but there are nearly 50 public and private access compressed natural gas fueling stations in New York.119,120
New York has 26 natural gas underground storage facilities with a combined total capacity of about 243 billion cubic feet of gas. Most are in depleted oil and gas reservoirs, but one is in a salt cavern. Those storage fields, along with storage in nearby states, are key to meeting natural gas demand spikes, particularly during the winter heating season.121 Virtually all major interstate pipelines from the Gulf Coast, Appalachia, and western Canada reach New York, both to supply in-state customers and to deliver supplies to New England.122
Coal
New York does not have any coal mines or coal reserves, and the state no longer has any coal-fired electricity generation.123 Deliveries to the electric power sector ended in 2019, and the state's last coal-fired power plant closed in March 2020.124,125 However, the industrial sector received about 266,000 tons of Pennsylvania coal in 2022.126 Some coal shipments move through the state's ports. In 2022, about 2.2 million tons of coal were exported through New York ports, which was less than 3% of the nation's total coal exports, and small amounts of imported coal entered the state at Buffalo.127
Endnotes
1 U.S. Census Bureau, Data & Maps, State Population Totals and Components of Change: 2020-2022, Annual Estimates of the Resident Population for the United States, Regions, States, the District of Columbia, and Puerto Rico: April 1, 2020 to July 1, 2022 (NST-EST2022-POP).
2 U.S. Energy Information Administration (EIA), State Energy Data System, Table C10, Total Energy Consumption Estimates, Real Gross Domestic Product (GDP), Energy Consumption Estimates per Real Dollar of GDP, Ranked by State, 2021.
3 Johnston, Matthew, "How New York Became the Center of American Finance," Investopedia (October 12, 2022).
4 U.S. Census Bureau, Library, Top 20 Cities, Highest Ranking Cities, 1790 to 2010 (July 19, 2012).
5 Castronuovo, Celine, "All 10 largest cities grew, Phoenix supplants Philly as 5th largest in US," The Hill (August 12, 2021).
6 U.S. Census Bureau, Data, Historical Population Density Data (1910-2020), accessed November 8, 2023.
7 U.S. Census Bureau, Quick Facts, New York City and New York State, accessed November 8, 2023.
8 Jennings, Ken, "Adirondack Park Is Bigger Than Death Valley and Yellowstone Combined," Condé Nast Traveler (April 18, 2018).
9 NETSTATE, New York, New York Almanac, accessed November 12, 2023.
10 Niagara Parks, Niagara Falls Geology, Facts and Figures, accessed November 8, 2023.
11 U.S. EIA, Electric Power Monthly (February 2023), Table 1.10.B.
12 U.S. Department of Energy, Energy Efficiency and Renewable Energy, WINDExchange, Wind Energy in New York, accessed November 8, 2023.
13 Roberts, Billy J., Solid Biomass Resources in the United States, National Renewable Energy Laboratory (January 15, 2014).
14 Solar Energy Industries Association, New York Solar, accessed November 9, 2023.
15 U.S. EIA, New York, Profile Data, Supply & Distribution, accessed November 9, 2023.
16 U.S. EIA, State Energy Data System, Table P3, Total Primary Energy Production and Total Energy Consumption Estimates in Trillion Btu, 2021.
17 U.S. EIA, State Energy Data System, Table C14, Total Energy Consumption Estimates per Capita by End-Use Sector, Ranked by State, 2021.
18 GLISA, Lake-effect Snow in the Great Lakes Region, accessed November 9, 2023.
19 NYSERDA, Monthly Cooling and Heating Degree Day Data, accessed November 9, 2023.
20 U.S. EIA, State Energy Data System, Table C1, Energy Consumption Overview: Estimates by Energy Source and End-Use Sector, 2021.
21 U.S. EIA, State Energy Data System, Table C14, Total Energy Consumption Estimates per Capita by End-Use Sector, Ranked by State, 2021.
22 U.S. Census Bureau, 2010 Census: New York Profile, Population Density by Census Tract.
23 U.S. Census Bureau, Data, Table B08301, Means of Transportation to Work, American Community Survey 1-Year Estimates, 2022, All States within United States, Puerto Rico, and the Island Areas.
24 U.S. Bureau of Economic Analysis, Interactive Data, Regional Data, GDP & Personal Income, Annual Gross Domestic Product (GDP) by State, GDP in Current Dollars, New York, All statistics in table, 2022.
25 U.S. EIA, State Energy Data System, Table C1, Energy Consumption Overview: Estimates by Energy Source and End-Use Sector, 2021.
26 U.S. EIA, Electricity Data Browser, Net generation for all sectors, New York, Fuel type (Check all), Annual, 2022.
27 U.S. EIA, New York Electricity Profile 2022, Tables 2A, 2B, 5.
28 U.S. EIA, Electricity, Form EIA-860 detailed data with previous form data (EIA-860A/860B), 2022 Form EIA-860 Data, Schedule 3, 'Generator Data' (Operable Units Only).
29 U.S. EIA, Electricity Data Browser, Net generation for all sectors, New York, Fuel type (Check all), Annual, 2022.
30 U.S. EIA, "About 13% of U.S. electricity generating capacity can switch between natural gas and oil," Today in Energy (February 11, 2020).
31 New York Independent System Operator, 2023 Power Trends, p. 39.
32 U.S. EIA, Electricity, Form EIA-860 detailed data with previous form data (EIA-860A/860B), 2022 Form EIA-860 Data, Schedule 3, 'Generator Data' (Operable Units Only).
33 U.S. EIA, Electricity Data Browser, Net generation for all sectors, New York, All fuels (utility-scale), Petroleum liquids, Small-scale solar photovoltaic, Annual, 2022
34 U.S. EIA, New York Electricity Profile 2022, Table 5, Electric power industry generation by primary energy source, 1990 through 2022.
35 U.S. EIA, Electricity Data Browser, Net generation for all sectors, New York, All fuels (utility-scale), Conventional hydroelectric, Small-scale solar photovoltaic, Annual, 2022.
36 U.S. EIA, Electricity, Preliminary Monthly Electric Generator Inventory (based on Form EIA-860M as a supplement to Form EIA-860), Inventory of Operating Generators as of September 2023 and Inventory of Retired Generators as of September 2023.
37 U.S. EIA, Electricity Data Browser, Net generation for all sectors, New York, All fuels, Nuclear, Small-scale solar photovoltaic, Annual, 2022.
38 U.S. EIA, Electricity Data Browser, Net generation for all sectors, New York, All fuels, Nuclear, Conventional hydroelectric, Other renewables, Small-scale solar photovoltaic, Annual, 2001-22.
39 U.S. EIA, Electricity Data Browser, Net generation for all sectors, New York, All fuels (utility-scale), Conventional hydroelectric, Other renewables, Wind, Biomass, All solar, Small-scale solar photovoltaic, Annual, 2001-22.
40 U.S. EIA, Electricity Data Browser, Net generation for all sectors, New York, All fuels (utility-scale), Coal, Petroleum, liquids, Small-scale solar photovoltaic, Annual, 2001-22.
41 Prohaska, Thomas J., "New York's last coal-burning power plant closes on Lake Ontario shore," The Buffalo News (March 30, 2020).
42 U.S. EIA, Electric Power Monthly (February 2023), Table 1.4.B.
43 U.S. Federal Energy Regulatory Commission, Electric Power Markets, New York (NYISO), updated May 16, 2023.
44 U.S. EIA, New York Electricity Profile 2022, Table 10, Supply and disposition of electricity, 1990 through 2022.
45 U.S. EIA, State Energy Data System, Table C17, Electricity Retail Sales, Total and Residential, Total and per Capita, Ranked by State, 2021.
46 U.S. EIA, Electricity Data Browser, Retail sales of electricity, New York, All sectors, Residential, Commercial, Industrial, Transportation, 2022.
47 U.S. Census Bureau, House Heating Fuel, New York, Table B25040, 2022 American Community Survey 1-Year Estimates.
48 New York Public Transit Association, Public Transit Facts, accessed November 12, 2023.
49 U.S. EIA, Electricity Data Browser, Retail sales of electricity, Transportation sector, All states, 2022.
50 U.S. EIA, Monthly Energy Review (November 2023), Appendix F, Electric Vehicle Charging Infrastructure.
51 U.S. EIA, Electric Power Monthly (February 2023), Tables 1.10.B, 1.11.B, 1.17.B.
52 U.S. EIA, Electricity Data Browser, Net generation from all sectors, New York, All fuels (Utility-scale), Conventional hydroelectric, Other Renewables (Total), Small-scale solar photovoltaic, Annual, 2001-22.
53 U.S. EIA, Electric Power Monthly (February 2023), Table 1.10.B.
54 U.S. EIA, Electricity Data Browser, Net generation from all sectors, New York, All fuels (Utility-scale), Conventional hydroelectric, Small-scale solar photovoltaic, Annual, 2022.
55 New York State, NY Power Authority, Niagara Power Project, accessed November 13, 2023.
56 World Atlas, World Facts, "The Largest Hydroelectric Power Stations In The United States," accessed November 13, 2023.
57 New York Power Authority, "A Powerful 50 Years at Niagara," International Water Power & Dam Construction (April 15, 2011).
58 U.S. EIA, Electricity Data Browser, Net generation from all sectors, New York, All fuels (utility-scale), All solar, Small-scale solar photovoltaic, Utility-scale photovoltaic, Annual, 2022.
59 NC Clean Energy Technology Center, DSIRE, Programs, New York, Solar Photovoltaics, accessed November 13, 2023.
60 U.S. EIA, Electric Power Monthly (February 2023), Table 1.17.B.
61 U.S. EIA, Preliminary Monthly Electric Generator Inventory (based on Form EIA-860M as a supplement to Form EIA-860), Inventory of Operating Generators as of September 2023.
62 U.S. EIA, Electric Power Monthly (November 2023), Table 6.2.B.
63 U.S. EIA, Electricity Data Browser, Net generation from all sectors, New York, All fuels (utility-scale), Conventional hydroelectric, Other renewables, Wind, Biomass, All utility-scale solar, All solar, Small-scale solar photovoltaic, Annual, 2001-22.
64 U.S. EIA, Electric Power Monthly (November 2023), Table 6.2.B.
65 U.S. EIA, Electricity, Preliminary Monthly Electric Generator Inventory (based on Form EIA-860M as a supplement to Form EIA-860), Inventory of Operating Generators as of September 2023.
66 U.S. Department of Energy, Energy Efficiency and Renewable Energy, WINDExchange, Wind Energy in New York, accessed November 14, 2023.
67 NC Clean Energy Technology Center, DSIRE, Offshore Wind Standard, updated June 29, 2021.
68 New York State Energy Research and Development Authority, Offshore Wind, Offshore Wind Projects, accessed November 14, 2023.
69 Richards, Heather, "Offshore wind is at a crossroads. Here's what you need to know," ENERGYWIRE (November 13, 2023).
70 U.S. EIA, Electricity Data Browser, Net generation from all sectors, New York, All fuels, Biomass, Small-scale solar photovoltaic, Annual, 2022
71 U.S. EIA, Electric Power Monthly (February 2023), Tables 1.15.B.
72 U.S. EIA, Preliminary Monthly Electric Generator Inventory (based on Form EIA-860M as a supplement to Form EIA-860), Inventory of Operating Generators as of September 2023.
73 U.S. EIA, Electricity Data Browser, Net generation from all sectors, New York, Biomass (Total), Wood and wood-derived fuels, Other biomass, Annual, 2022.
74 U.S. EIA, Monthly Densified Biomass Fuel Report, Table 1, Densified biomass fuel manufacturing facilities in the United States by state, region, and capacity, August 2023.
75 Larson, B. K., "U.S. Gasoline Requirements as of January 2018," ExxonMobil, accessed November 14, 2023.
76 U.S. EIA, State Energy Data System, Table P1, Primary Energy Production Estimates in Physical Units, 2021.
77 U.S. EIA, State Energy Data System, Table F25, Fuel ethanol consumption estimates, 2021.
78 U.S. EIA, U.S. Fuel Ethanol Plant Production Capacity, U.S. Fuel Ethanol Plant Production Capacity as of January 1, 2023.
79 U.S. EIA, State Energy Data System, Table F25, Fuel ethanol consumption estimates, 2021.
80 New York State Energy Research and Development Authority, Energy Infrastructure Reports, New York State Energy Assurance Plan (September 14, 2012), p. IV-7.
81 U.S. EIA, U.S. Biodiesel Plant Production Capacity, U.S. biodiesel plant count by state, 2023.
82 U.S. EIA, State Energy Data System, Table F26, Biodiesel Consumption Estimates, 2021.
83 U.S. Census Bureau, Data & Maps, State Population Totals and Components of Change: 2020-2022, Annual Estimates of the Resident Population for the United States, Regions, States, the District of Columbia, and Puerto Rico: April 1, 2020 to July 1, 2022 (NST-EST2022-POP).
84 NC Clean Energy Technology Center, DSIRE, New York, Renewable Portfolio Standard, updated June 26, 2018.
85 NC Clean Energy Technology Center, DSIRE, New York, Clean Energy Standard, updated June 29, 2021.
86 Roberts, David, "New York just passed the most ambitious climate target in the country," Vox (July 22, 2019).
87 U.S. EIA, Environment, Energy-Related CO2 Emission Data Tables, Table 4, Per capita energy-related carbon dioxide emissions by state (1970-21).
88 U.S. EIA, New York Field Production of Crude Oil (Thousand Barrels), Annual, 1981-2022.
89 U.S. EIA, Proved Nonproducing Reserves, Crude Oil, Annual, 2016-21.
90 New York State Energy Research and Development Authority, New York's Natural Gas and Oil Resource Endowment: Past, Present and Potential, Part 1 (2007), Crude Oil Refining in New York State, p. 10.
91 U.S. EIA, New York Number of Operable Refineries as of January 1, 1982-2023.
92 New York State Energy Research and Development Authority, Energy Infrastructure Reports, New York State Energy Assurance Plan, New York State Energy Assurance Plan (September 14, 2012) p. IV-6-IV-7, V-28-V-36.
93 U.S. EIA, State Energy Data System, Table C15, Petroleum Consumption Estimates, Total and per Capita, Ranked by State, 2021.
94 U.S. EIA, State Energy Data System, Table F16, Total Petroleum Consumption Estimates, 2021.
95 U.S. EIA, State Energy Data System, Table C2, Energy Consumption Estimates for Selected Energy Sources in Physical Units, 2021.
96 U.S. EIA, State Energy Data System, Table C14, Total Energy Consumption Estimates per Capita by End-Use Sector, Ranked by State, 2021.
97 U.S. EIA, State Energy Data System, Table C2, Energy Consumption Estimates for Selected Energy Sources in Physical Units, 2021.
98 U.S. Census Bureau, Data & Maps, State Population Totals and Components of Change: 2020-2022, Annual Estimates of the Resident Population for the United States, Regions, States, the District of Columbia, and Puerto Rico: April 1, 2020 to July 1, 2022 (NST-EST2022-POP).
99 U.S. EIA, State Energy Data System, Table F16, Total Petroleum Consumption Estimates, 2021.
100 U.S. Census Bureau, House Heating Fuel, New York, Table B25040, 2022 American Community Survey 1-Year Estimates.
101 U.S. Department of Energy, Office of Fossil Energy, Northeast Home Heating Oil Reserve (NEHHOR) History and About NEHHOR, accessed November 16, 2023.
102 U.S. EIA, "Sulfur content of heating oil to be reduced in northeastern states," Today in Energy (April 18, 2012).
103 U.S. EIA, State Energy Data System, Table F16, Total Petroleum Consumption Estimates, 2021.
104 U.S. EIA, Dry Natural Gas Proved Reserves, Proved reserves as of December 31, 2016-2021.
105 U.S. EIA, New York Natural Gas Gross Withdrawals, 1967-2022.
106 New York State Energy Research and Development Authority, New York's Natural Gas and Oil Resource Endowment: Past, Present and Potential, Part 1 (2007), Crude Oil Refining in New York State, p. 8.
107 U.S. EIA, New York Natural Gas Gross Withdrawals, 1967-2022.
108 U.S. EIA, International and Interstate Movements of Natural Gas by State, New York, Annual, 2017-22.
109 Soeder, Daniel J., Resource and Environmental Studies on the Marcellus Shale, National Energy Technology Laboratory (2008), p. 5-6.
110 U.S. EIA, Top 100 U.S. Oil and Gas Fields (March 2015), p. 4.
111 Kaplan, Thomas, "Citing Health Risks, Cuomo Bans Fracking in New York State," The New York Times (December 17, 2014).
112 Guerrero, Marisa, "New York State Codifies Fracking Ban in Budget," Natural Resources Defense Council (April 3, 2020).
113 U.S. EIA, Marcellus Shale Play Geology review, Updates to the Marcellus Shale Play Maps (January 2017), p. 3.
114 U.S. Geological Survey, USGS Estimates 214 trillion Cubic Feet of Natural Gas in Appalachian Basin Formations, Press Release (October 3, 2019).
115 U.S. EIA, State Energy Data System, Table C16, Natural Gas Consumption, Total and per Capita, Ranked by State, 2021.
116 U.S. EIA, Electricity Data Browser, Net generation for all sectors, New York, All fuels, Natural gas, Small-scale solar photovoltaic, Annual, 2022.
117 U.S. Census Bureau, House Heating Fuel, New York, Table B25040, 2022 American Community Survey 1-Year Estimates.
118 U.S. EIA, Natural Gas Consumption by End Use, New York, Annual, 2017-22.
119 U.S. Department of Energy, Alternative Fuels Data Center, Alternative Fueling Station Locator, Advanced Filters, New York, Compressed Natural Gas, Access Public and Private, Available, accessed November 17, 2023.
120 U.S. EIA, Underground Natural Gas Storage Capacity, New York, Annual, 2017-22.
121 U.S. EIA, Natural Gas Pipelines in the Northeast Region, accessed November 17, 2023.
122 U.S. EIA, Annual Coal Report 2022 (October 2023), Table 1, Coal Production and Number of Mines by State and Mine Type, 2022 and 2021, and Table 15, Recoverable Coal Reserves at Producing Mines, Estimated Recoverable Reserves, and Demonstrated Reserve Base by Mining Method, 2022.
123 U.S. EIA, Coal Data Browser, Coal shipments to the electric power sector: quantity, by plant state, New York, All coal, Annual, 2018-22.
124 Prohaska, Thomas J., "New York's last coal-burning power plant closes on Lake Ontario shore," The Buffalo News (March 30, 2020).
125 U.S. EIA, Annual Coal Distribution Report 2022 (October 2023), By Coal Destination State, New York, Table DS-28, Domestic Coal Distribution, by Destination State, 2021.
126 U.S. EIA, Quarterly Coal Report, October-December 2022 (April 2023), Table 13, Coal Exports by Customs District, and Table 20, Coal Imports by Customs District.
Other Resources
Energy-Related Regions and Organizations
- Petroleum Administration for Defense District (PADD): 1B
- Regional Transmission Organization (RTO) and Independent System Operator (ISO): New York Independent System Operator (NYISO)
- North American Electric Reliability Corporation (NERC) ERO Enterprise: Regional Entities: Northeast Power Coordinating Council (NPCC)
Other Websites
- New York State Department of Public Service
- New York State, Homes and Community Renewal, Weatherization Assistance Program
- New York State Office of Temporary and Disability Assistance, Home Energy Assistance Program
- NY Power Authority
- New York State Department of Environmental Conservation, Oil and Gas
- New York State Department of Environmental Conservation, Energy and Climate
- New York State Energy Research and Development Authority (NYSERDA)
- NYSERDA, Home Energy Efficiency Programs
- NYSERDA, Expand Your Clean Energy Offerings
- NYSERDA, Clean Energy Standard
- New York City, Citywide Administrative Services, Energy Management
- Open NY Data Portal
- New York Independent System Operator
- U.S. Nuclear Regulatory Commission, New York
- EIA New York Flickr Album
- Alternative Fuels Data Center, Federal and State Laws and Incentives
- Benefits.Gov, Housing and Public Utilities
- NC Clean Energy Technology Center, Database of State Incentives for Renewables and Efficiency (DSIRE)
- National Association of Regulatory Utility Commissioners (NARUC)
- National Association of State Energy Officials (NASEO)
- National Conference of State Legislatures (NCSL), Research and Policy
- National Renewable Energy Laboratory (NREL), Geospatial Data Science Data and Tools
- U.S. Geological Survey (USGS), Publications
- Interstate Oil and Gas Compact Commission
- EIA Status of U.S. Nuclear Outages
- U.S. Department of the Interior, Bureau of Ocean Energy Management
- U.S. Department of Health and Human Services, Administration for Children and Families, Office of Community Services, Low Income Home Energy Assistance Program (LIHEAP)
- U.S. Geological Survey, Maps
- Lawrence Livermore National Laboratory, Energy Flow Charts
- National Renewable Energy Laboratory, State and Local Planning for Energy (SLOPE)
- The Regional Greenhouse Gas Initiative
- EIA Natural Gas Storage Dashboard
- EIA Energy Disruptions
- U.S. Department of Agriculture (USDA), Rural Development, Energy Programs