Montana Quick Facts
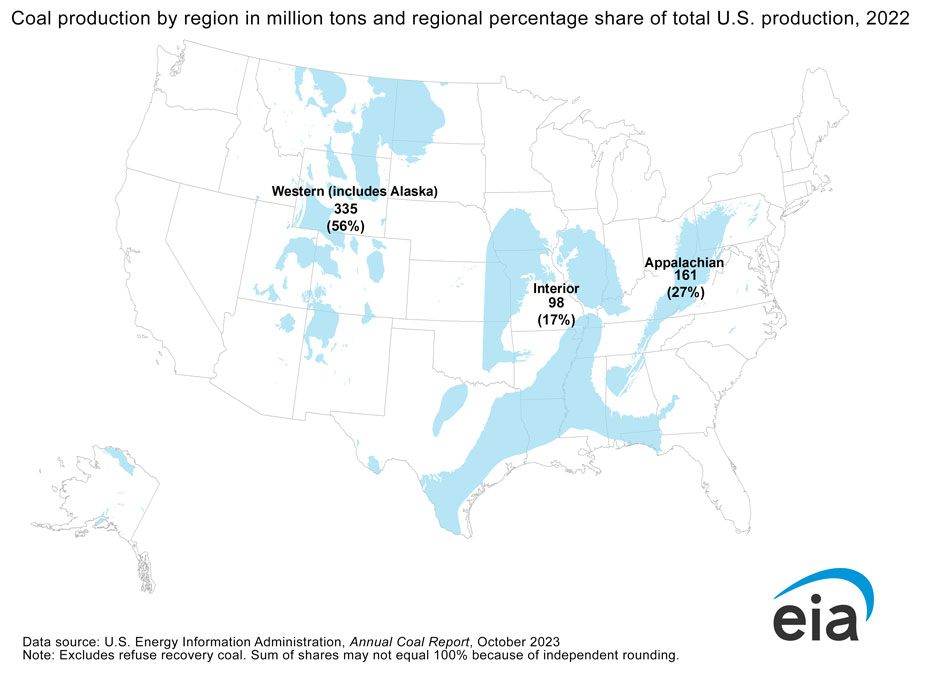
- Montana has the nation's largest estimated recoverable coal reserves, which is 30% of the U.S. total, and the state accounts for about 5% of U.S. coal production.
- Montana’s temperature extremes and its small population contribute to the state’s residential sector being among the top five states with the highest per capita energy consumption.
- Montana has substantial renewable energy resources, and in 2024 it ranked 10th among the states with the largest share of electricity generated from renewables, about 57%.
- Coal-fired power plants provided the largest share of Montana's electricity generation in 2024, accounting for 37% of in-state generation.
- Montana’s total natural gas consumption is among the 10 lowest states. About half of state households use natural gas as their primary energy source for home heating.
Last Updated: June 20, 2025
Data
Last Update: June 20, 2025 | Next Update: July 17, 2025
| Prices | |||||
|---|---|---|---|---|---|
| Petroleum | Montana | U.S. Average | Period | find more | |
| Domestic Crude Oil First Purchase | $ 61.53 /barrel | $ 67.07 /barrel | Mar-25 | ||
| Natural Gas | Montana | U.S. Average | Period | find more | |
| City Gate | $ 3.22 /thousand cu ft | $ 4.88 /thousand cu ft | Mar-25 | find more | |
| Residential | $ 8.40 /thousand cu ft | $ 14.57 /thousand cu ft | Mar-25 | find more | |
| Coal | Montana | U.S. Average | Period | find more | |
| Average Sales Price | $ 46.56 /short ton | $ 54.04 /short ton | 2023 | ||
| Delivered to Electric Power Sector | W | $ 2.44 /million Btu | Mar-25 | ||
| Electricity | Montana | U.S. Average | Period | find more | |
| Residential | 11.96 cents/kWh | 17.11 cents/kWh | Mar-25 | find more | |
| Commercial | 11.28 cents/kWh | 13.27 cents/kWh | Mar-25 | find more | |
| Industrial | 6.73 cents/kWh | 8.26 cents/kWh | Mar-25 | find more | |
| Reserves | |||||
|---|---|---|---|---|---|
| Reserves | Montana | Share of U.S. | Period | find more | |
| Crude Oil (as of Dec. 31) | 388 million barrels | 0.8% | 2022 | find more | |
| Expected Future Production of Dry Natural Gas (as of Dec. 31) | 624 billion cu ft | 0.1% | 2022 | find more | |
| Expected Future Production of Natural Gas Plant Liquids | 14 million barrels | * | 2022 | find more | |
| Recoverable Coal at Producing Mines | 383 million short tons | 3.4% | 2023 | find more | |
| Rotary Rigs & Wells | Montana | Share of U.S. | Period | find more | |
| Natural Gas Producing Wells | 5,043 wells | 1.0% | 2020 | find more | |
| Capacity | Montana | Share of U.S. | Period | ||
| Crude Oil Refinery Capacity (as of Jan. 1) | 214,600 barrels/calendar day | 1.2% | 2024 | ||
| Electric Power Industry Net Summer Capacity | 7,175 MW | 0.6% | Mar-25 | ||
| Supply & Distribution | |||||
|---|---|---|---|---|---|
| Production | Montana | Share of U.S. | Period | find more | |
| Total Energy | 731 trillion Btu | 0.7% | 2022 | find more | |
| Crude Oil | 77 thousand barrels per day | 0.6% | Mar-25 | find more | |
| Natural Gas - Marketed | 41,172 million cu ft | 0.1% | 2023 | find more | |
| Coal | 29,072 thousand short tons | 5.0% | 2023 | find more | |
| Total Utility-Scale Net Electricity Generation | Montana | Share of U.S. | Period | find more | |
| Total Net Electricity Generation | 2,310 thousand MWh | 0.7% | Mar-25 | ||
| Utility-Scale Net Electricity Generation (share of total) | Montana | U.S. Average | Period | ||
| Petroleum-Fired | * | 0.3 % | Mar-25 | find more | |
| Natural Gas-Fired | 3.2 % | 35.6 % | Mar-25 | find more | |
| Coal-Fired | 36.1 % | 14.7 % | Mar-25 | find more | |
| Nuclear | 0.0 % | 18.7 % | Mar-25 | find more | |
| Renewables | 57.7 % | 30.3 % | Mar-25 | ||
| Stocks | Montana | Share of U.S. | Period | find more | |
| Motor Gasoline (Excludes Pipelines) | 490 thousand barrels | 4.6% | Mar-25 | ||
| Distillate Fuel Oil (Excludes Pipelines) | 1,169 thousand barrels | 1.3% | Mar-25 | find more | |
| Natural Gas in Underground Storage | 196,583 million cu ft | 3.1% | Mar-25 | find more | |
| Petroleum Stocks at Electric Power Producers | 12 thousand barrels | 0.1% | Mar-25 | find more | |
| Coal Stocks at Electric Power Producers | W | W | Mar-25 | find more | |
| Fueling Stations | Montana | Share of U.S. | Period | ||
| Motor Gasoline | 479 stations | 0.4% | 2022 | ||
| Propane | 28 stations | 1.1% | May-25 | ||
| Electric Vehicle Charging Locations | 142 stations | 0.2% | May-25 | ||
| E85 | 0 stations | 0.0% | May-25 | ||
| Biodiesel, Compressed Natural Gas, and Other Alternative Fuels | 1 stations | * | May-25 | ||
| Consumption & Expenditures | |||||
|---|---|---|---|---|---|
| Summary | Montana | U.S. Rank | Period | ||
| Total Consumption | 382 trillion Btu | 43 | 2023 | find more | |
| Total Consumption per Capita | 352 million Btu | 15 | 2022 | find more | |
| Total Expenditures | $ 6,555 million | 45 | 2023 | find more | |
| Total Expenditures per Capita | $ 6,378 | 10 | 2022 | find more | |
| by End-Use Sector | Montana | Share of U.S. | Period | ||
| Consumption | |||||
| » Residential | 80 trillion Btu | 0.4% | 2023 | find more | |
| » Commercial | 71 trillion Btu | 0.4% | 2023 | find more | |
| » Industrial | 116 trillion Btu | 0.4% | 2023 | find more | |
| » Transportation | 115 trillion Btu | 0.4% | 2023 | find more | |
| Expenditures | |||||
| » Residential | $ 1,173 million | 0.4% | 2023 | find more | |
| » Commercial | $ 959 million | 0.4% | 2023 | find more | |
| » Industrial | $ 888 million | 0.4% | 2023 | find more | |
| » Transportation | $ 3,535 million | 0.5% | 2023 | find more | |
| by Source | Montana | Share of U.S. | Period | ||
| Consumption | |||||
| » Petroleum | 33 million barrels | 0.4% | 2023 | find more | |
| » Natural Gas | 92 billion cu ft | 0.3% | 2023 | find more | |
| » Coal | 7,545 thousand short tons | 1.8% | 2023 | find more | |
| Expenditures | |||||
| » Petroleum | $ 4,296 million | 0.5% | 2023 | find more | |
| » Natural Gas | $ 644 million | 0.3% | 2023 | find more | |
| » Coal | $ 315 million | 1.3% | 2023 | find more | |
| Consumption for Electricity Generation | Montana | Share of U.S. | Period | find more | |
| Petroleum | NM | NM | Mar-25 | find more | |
| Natural Gas | 704 million cu ft | 0.1% | Mar-25 | find more | |
| Coal | 548 thousand tons | 2.0% | Mar-25 | find more | |
| Energy Source Used for Home Heating (share of households) | Montana | U.S. Average | Period | ||
| Natural Gas | 48.0 % | 46.0 % | 2023 | ||
| Fuel Oil | 0.8 % | 3.7 % | 2023 | ||
| Electricity | 28.6 % | 41.7 % | 2023 | ||
| Propane | 13.3 % | 5.0 % | 2023 | ||
| Other/None | 9.3 % | 3.5 % | 2023 | ||
| Environment | |||||
|---|---|---|---|---|---|
| Renewable Energy Capacity | Montana | Share of U.S. | Period | find more | |
| Total Renewable Energy Electricity Net Summer Capacity | 4,902 MW | 1.3% | Mar-25 | ||
| Ethanol Plant Nameplate Capacity | -- | -- | 2024 | ||
| Renewable Energy Production | Montana | Share of U.S. | Period | find more | |
| Utility-Scale Hydroelectric Net Electricity Generation | 725 thousand MWh | 3.3% | Mar-25 | ||
| Utility-Scale Solar, Wind, and Geothermal Net Electricity Generation | 606 thousand MWh | 0.8% | Mar-25 | ||
| Utility-Scale Biomass Net Electricity Generation | 2 thousand MWh | 0.1% | Mar-25 | ||
| Small-Scale Solar Photovoltaic Generation | 12 thousand MWh | 0.1% | Mar-25 | ||
| Fuel Ethanol Production | 0 thousand barrels | 0.0% | 2022 | ||
| Renewable Energy Consumption | Montana | U.S. Rank | Period | find more | |
| Renewable Energy Consumption as a Share of State Total | 17.3 % | 8 | 2022 | ||
| Fuel Ethanol Consumption | 1,224 thousand barrels | 42 | 2022 | ||
| Total Emissions | Montana | Share of U.S. | Period | find more | |
| Carbon Dioxide | 29.5 million metric tons | 0.6% | 2022 | ||
| Electric Power Industry Emissions | Montana | Share of U.S. | Period | find more | |
| Carbon Dioxide | 13,774 thousand metric tons | 0.9% | 2023 | ||
| Sulfur Dioxide | 8 thousand metric tons | 0.9% | 2023 | ||
| Nitrogen Oxide | 12 thousand metric tons | 1.1% | 2023 | ||
Analysis
Last Updated: June 20, 2025
Overview
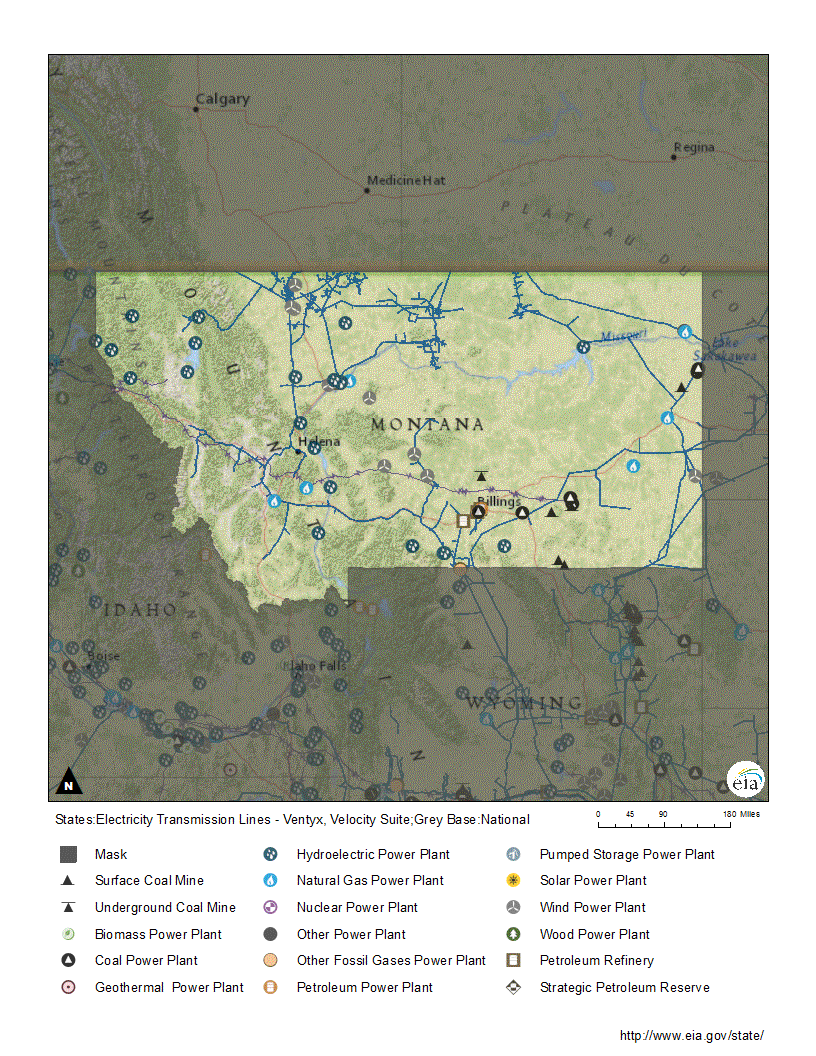
Montana, known as Big Sky State, is the fourth-largest state by total area.1,2 It is landlocked and bordered by Idaho to the west, Wyoming to the south, and North Dakota and South Dakota to the east. To the north, Montana has a 545-mile border with three Canadian provinces.3,4 The state is rich in both fossil fuels and renewable resources and is a net supplier of energy to the rest of the nation.5,6 Three-tenths of the nation's estimated recoverable coal reserves are in Montana, and the northern and eastern areas of the state contain deposits of crude oil and natural gas.7,8,9 The Continental Divide runs along the state's western mountains, making Montana the only state in the nation with rivers that drain into the Pacific Ocean, the Gulf of Mexico, and Canada's Hudson Bay.10 The Missouri River, the longest river in the United States, starts in the Rocky Mountains in western Montana and flows eastward across the state.11,12 The river and its tributaries offer substantial hydroelectric energy resources.13,14 Montana's western mountains, which range in elevation from 1,800 to 12,800 feet, create a climate with snowy winters and cool summers, with large variations in temperature, in the western one-third of the state. The central and eastern two-thirds of the state, which are part of the Northern Great Plains, experience warm summers and cold winters.15,16 The state's vast plains provide Montana with some of the best wind resources in the nation.17,18 Montana has the third-lowest population density among U.S. states, averaging about 7 people per square mile.19 Montana's population crossed the 1 million threshold in 2012 and continues to grow, but still ranks among the 10 states with the fewest residents.20,21 Montana's residents are clustered in and around a few cities, mainly in the valleys of the Missouri River and its tributaries. Much of the eastern third of the state has, on average, less than one resident per square mile.22,23 Montana ranks second only to Texas with almost 58 million acres of land in farms and ranches.24
Montana's early economy was built around mining, ranching, wheat farming, and timber. After World War II, spurred by popular destinations such as Glacier and Yellowstone National Parks, tourism increased. In 1970, tourism surpassed mining to become the second-largest industry in the state after agriculture.25,26 Today, finance, insurance, real estate, rentals, and leasing are the largest contributors to the state's GDP, but energy resource extraction and mining continue to be significant parts of the state's economy.27 Mining, crude oil and natural gas production, petroleum refining, and agricultural industries are all energy-intensive. Those industries, as well as the amount of transportation fuels used to travel long distances within the state and the state's small population, help place Montana's per capita energy consumption near the top one-third of the states, even though its total energy consumption is among the 10 lowest states.28,29,30,31
Montana’s residential sector per capita energy consumption ranks among the top five states.
The industrial sector leads Montana's end-use energy consumption, accounting for 30% of the state total, followed by the transportation sector at 29%. The residential sector makes up 23% of the state's energy use, and the commercial sector accounts for 18%.32 Montana's summer heat can exceed 100°F on the plains and winter can bring bitterly cold subzero temperatures.33 The state's temperature extremes and its small population contribute to Montana's residential sector being among the top five states with the highest per capita energy consumption.34
Coal
Montana holds about 30% of U.S. total estimated recoverable coal reserves.
Montana has the largest estimated recoverable coal reserves among the states, accounting for about 30% of the U.S. total.35 Montana is the fifth-largest coal-producing state. In 2024, the state produced 5% of the nation's coal, with production declining by 7% from the previous year.36 Most of Montana's coal production comes from four large surface mines in the Powder River Basin in the southeastern corner of the state and one underground mine in the south central part of the state.37 Montana's Spring Creek Coal mine is the eighth-largest U.S. coal-producing mine and the largest coal mine outside of the state of Wyoming.38 The state's Rosebud surface mine supplies almost all of its production to Montana's largest electricity generating plant—the Colstrip coal-fired power plant located next to the mine. Two of the plant's 4 generating units were retired in early 2020, reducing the plant's generating capacity to about 1,500 megawatts.39,40,41,42
In 2023, almost half of Montana's coal was exported to other countries, mostly to western Canada, where much of it was shipped on to Asia.43,44 The state was the second-largest coal exporter in the western United States after Wyoming.45 About three-tenths of Montana's coal was sent to other states, mainly by rail to Michigan, Minnesota, and Washington, for electricity generation. The remainder of Montana's distributed coal was delivered within the state, almost all to the electric power sector.46,47 Montana's coal production declined by about 40% from 2010 to 2024, mainly because of competition from natural gas and renewable energy sources as fuel for electricity generation and retirements of coal-fired power plants.48,49,50,51
Petroleum
Montana holds 0.8% of U.S. total proved crude oil reserves, and the state accounts for about 0.6% of U.S. oil produced annually.52,53 Most of Montana's crude oil production comes from the Bakken Formation in the northeastern corner of the state along the border with North Dakota.54,55 Montana's Elm Coulee field, which began producing oil in 2001, was initially the most prolific oil field in the Williston Basin, a geologic basin that spreads from eastern Montana into North Dakota and Canada.56,57,58 However, the state's oil production declined from its 2006 peak of nearly 100,000 barrels per day as drilling activity moved to North Dakota, where the Bakken Shale formation is thicker, covers a larger area, and holds more oil. In 2024, Montana's annual crude oil production increased for a third consecutive year to 74,000 barrels per day, the highest output level since 2015.59,60
Montana’s four refineries can process about 205,000 barrels of crude oil per calendar day.
Montana has four refineries with a combined crude oil processing capacity of about 205,000 barrels per calendar day.61 The three larger refineries are located in the Billings area. A smaller refinery in Great Falls finished an expansion project in 2023 that allowed it to make renewable aviation fuel from animal fat and vegetable oil.62,63,64 The refineries receive crude oil mainly from Canada and Wyoming and produce a wide range of refined products, including motor gasoline, ultra-low sulfur diesel fuels, aviation fuels, butane, propane, petroleum coke, and asphalt.65,66,67,68 Pipelines and railroads are used to ship crude oil to the refineries and to transport the facilities' refined products throughout Montana and to nearby states. Several pipelines carry Montana crude oil to refineries in other states as well.69
Although Montana's total petroleum consumption is among the lowest 10 states, its small population helps place it among the top 10 states in petroleum consumption per capita.70 The transportation sector consumes about two-thirds of the petroleum used in Montana.71 The state ranks among the top 10 in both per capita gasoline expenditures and per capita annual vehicle miles traveled.72,73 During the winter months, federal air quality standards required oxygenated motor gasoline use in the Missoula metropolitan area near the Idaho border, but this requirement was suspended in February 2025.74,75,76 Montana has no ethanol production plants, but it receives ethanol from other states that is blended with motor gasoline at Montana's petroleum product terminals.77,78 In January 2024, Montana updated its fuel regulations allowing the sale of E15 fuel blend, which contains 15% ethanol.79,80 The industrial sector is the second-largest consumer of petroleum, accounting for about one-fifth of the state's total use. The residential sector—where about 1 out of 7 households heat with propane, fuel oil, or kerosene—the electric power sector, and the commercial sector together make up about 14% of the state's petroleum consumption.81,82
Electricity
In 2024, coal generated 37% of Montana's in-state generation. Until 2017, coal consistently supplied more than half of its in-state generation. However, over the past decade coal's share declined because of the growth of renewable electricity, retirement of coal-fired power plants, and increased use of natural gas.83,84,85,86 In 2020, hydroelectric power generation exceeded coal-fired generation for the first time in about four decades before coal returned to the top spot again in 2021.87,88
In 2024, hydropower accounted for about 33% of Montana's in-state electricity generation, the fifth-highest share of hydropower among the states.89,90 Hydroelectric generation has a long history in Montana and dominated electricity generation until the mid-1980s, when it was overtaken by coal-powered generation.91 Since 2022, hydroelectric generation in the state has been declining due to the drought conditions in the Western states—especially Oregon and Washington—which has led to historically low hydroelectric generation in these states.92,93 While the state's largest power plant by generating capacity in 2024 was coal-fired, 6 of the 10 largest were hydroelectric.94 A pumped hydro storage project, Gordon Butte Pumped Storage, with 400 megawatts of generating capacity is in development in Central Montana and is scheduled to come online in 2032.95 Pumped-storage hydroelectric plants generate electricity during peak demand periods, when power prices are higher, using water pumped into an elevated storage reservoir during off-peak periods and then releasing it to flow back to a lower reservoir through turbine generators when additional power is needed.96 In 2024, wind power accounted for 22% of the state's generation, the third-largest share, and natural gas provided 4%. Petroleum coke accounted for 1% of Montana's generation, the highest share of any state.97,98 Montana has no nuclear power plants.99
Montana consumers use about two-thirds of the electricity generated in the state.100 The excess power is sent over high-voltage transmission lines to other western states, mostly Washington and Oregon.101 Several transmission projects are in development that will increase capacity to move Montana-generated electricity to other states.102,103 Most of Montana is part of the Western Interconnection, an electric grid which serves western states, Canadian provinces, and a small part of northern Mexico. A portion of eastern Montana is connected to the Eastern Interconnection of the U.S. grid.104,105 One of the nation's seven converter stations that connect the eastern and western electric grids is located at Miles City, Montana.106
In 2024, the residential sector accounted for 37% of the electricity sales in the state, followed by the commercial sector with about 33% and the industrial sector with 31%.107 About 3 in 10 Montana households use electricity as their primary heating source.108 In 2024, Montana's average electricity price was below the national average and less than about two-thirds of the states.109
As April 2025, Montana had 139 public electric vehicle charging locations, ranking among the 5 states with the fewest charging locations in the nation.110 The charging locations are mostly located in Montana's largest cities—Billings, Missoula, Great Falls, and Bozeman—and along major interstate highways.111 With fewer than 5,000 registered battery electric vehicles in 2023, Montana has one of the lowest number of battery electric vehicles in the nation.112
Renewable energy
In 2024, Montana was the nation’s sixth-largest producer of hydroelectric power.
Montana has substantial renewable energy resources, and in 2024 it ranked 10th among the states with the largest share of electricity generated from renewables. Renewable energy, primarily hydropower and wind, accounted for about 57% of Montana's in-state electricity generation.113,114 The state's mountainous terrain along the Continental Divide creates fast-running rivers from the 300 inches of snow and rain that fall in the region annually and provide the water resources for hydroelectric power generation. The headwaters of the Missouri River, the longest river in North America, are in the mountains of southwestern Montana.115,116 In 2024, Montana was the sixth-largest producer of hydroelectric power in the nation.117 The state has 23 utility-scale (1 megawatt or larger) hydroelectric plants, and most of them are located in the western half of the state.118,119 In 2023, 6 of Montana's 10 largest power plants by electricity generation, 6 were hydroelectric facilities.120 The state is also home to the first Tribally-owned hydroelectric plant in the United States—the 228-megawatt Seli'š Ksanka Qlispe' plant—on the Flathead River.121,122
With its broad plains dotted with hills, wide river valleys, and occasional mountains, eastern Montana has some of the best utility-scale wind power potential in the nation.123,124 The first utility-scale wind farm in the state came online in 2005.125 Wind energy powers 3 of the state's 10 largest generating plants both by capacity and annual generation.126 The state's largest wind facility, the 366-megawatt Clearwater wind farm, began operating in eastern Montana at the end of 2022. In early 2025, the state had nearly 1,900 megawatts of wind power generating capacity in operation. Another 150 megawatts of wind capacity and related battery energy storage are scheduled to come online by 2027.127
In 2024, solar energy generated about 2% of Montana's in-state generation.128 Montana's solar power was provided only by customer-sited, small-scale (less than 1 megawatt) residential and business solar panel installations until 2017, when the state's first utility-scale power facilities began generating electricity. In early 2025, Montana had nine utility-scale solar power farms with a combined generating capacity of 181 megawatts.129
Montana has biomass resources, and about 7 in 100 households heat their homes with wood. The state has the third-highest share of wood-burning households, after Vermont and Maine. However, very little electricity generation in the state comes from biomass.130,131,132,133 The state's only utility-scale wood biomass-fueled generating facility has 3.0 megawatts of capacity and is owned by a lumber company in northwest Montana. An electric cooperative owns a 3.2-megawatt plant that is fueled by landfill gas.134,135,136
Montana enacted in 2005 a renewable portfolio standard (RPS) that required retail electricity retail suppliers to acquire at least 15% of the electricity they sell in-state from renewable energy sources by 2015.137 The state reached the requirement in 2015 and continued to exceed it, which led the state legislature to repeal the RPS in 2021.138,139 Montana provides low-interest loans to households and businesses to pay for energy-saving measures, like energy-efficient appliances and windows. The loans also cover alternative energy systems, including solar panels, geothermal systems, wind generators, and low-emission wood stoves.140
Natural gas
Montana accounts for about 0.1% of U.S. total natural gas reserves and marketed production.141,142 The state's natural gas production is about one-third of what it was at its peak in 2007. However, natural gas production has been increasing since 2020 and reached a five-year high in 2024.143 Production from coalbed methane wells has been declining since 2008 and remained unchanged in 2024.144 About three-fourths of Montana's natural gas production comes from wells located in the northern part of the state near the Canadian border. Almost all the remaining natural gas production comes from wells in the Williston Basin in northeastern Montana near the North Dakota border.145,146
Montana has the largest single underground natural gas storage site in the nation.
Montana consumes about twice as much natural gas as it produces.147,148 Interstate natural gas pipelines cross Montana from Canada, North Dakota, and Wyoming.149,150 In 2023, about 78% of the natural gas that entered the state came from Canada, crossing the border at three import points of entry, while 12% of the natural gas came from Wyoming and 10% from North Dakota.151,152 In 2024, about 6% of all the natural gas the United States imported by pipeline from Canada entered through Montana.153 About three-fourths of the natural gas that enters Montana leaves the state, almost all of it continuing on to North Dakota on its way to Midwestern markets.154 Some of the natural gas that enters Montana is put in storage. The state has more underground natural gas storage capacity than any other state in the Rocky Mountain region and has the nation's largest single underground storage site—the depleted Baker field in the Williston Basin in eastern Montana that can hold 287 billion cubic feet of gas.155,156
Montana's total natural gas consumption is among the 10 lowest states. However, with its cold winters and small population, Montana ranks near the middle of the states in per capita natural gas use.157,158 The industrial sector is the largest natural gas consumer in Montana, accounting for 32% of the state's total natural gas use, followed by the commercial sector at 30%. The residential sector makes up about 25% of natural gas consumption and the electric power sector accounts for about 13%.159 About half of Montana households use natural gas as their primary energy source for home heating.160
Energy on tribal lands
More than 6.4 million acres in Montana, about 7% of the state's total land area, are Native American tribal lands.161,162 Montana has 7 reservations that are home to 12 tribes and more than 63,000 Native Americans.163,164 In December 2019, the U.S. Department of the Interior updated regulations to make it easier for tribes to control development of energy resources on their lands.165 Most of Montana's tribal lands sit on top of coal, crude oil, or natural gas resources.166,167
The largest reservation in the state, the Crow Nation Reservation, covers 2.2 million acres in south-central Montana.168 The Crow Tribe mined some of its estimated 25 million tons of coal reserves from the Absaloka coal mine, but the mine stopped coal production in April 2024, due to declining demand from the single power plant that used the coal.169,170 The Crow Nation Reservation also has crude oil and natural gas resources.171 The Northern Cheyenne Reservation in southeastern Montana, adjacent to the Crow Nation Reservation, also has large coal reserves, but the Northern Cheyenne Tribe does not mine its coal.172 The Blackfeet Reservation—located on the eastern slopes of the Rocky Mountains near Glacier National Park with more than 1.5 million acres—has crude oil and natural gas resources. In September 2023, after an almost 10-year court battle, the last oil and gas lease in Badger-Two Medicine, an area considered sacred, was relinquished.173,174,175,176 Crude oil was discovered in the early 1950s on the Fort Peck Reservation, which is home to two tribes and is the second-largest reservation in the state at over 2 million acres. The Fort Peck Reservation is located in northeastern Montana, and it overlies the western edge of the Bakken formation, where there is crude oil production.177,178
Much of Montana's tribal lands also have abundant renewable energy resources. The Fort Peck, Blackfeet, and Crow Nation reservations are among the 15 reservations in the nation with the greatest potential for wind-powered electricity generation, and the Fort Peck Reservation has some of the highest potential for solar power generation.179 The Flathead and Crow tribal lands have some of the largest hydropower potential among U.S. tribal lands.180 The Salish and Kootenai tribes, on the Flathead Reservation in western Montana, became the first tribal owners and operators of a major hydroelectric facility in the nation when they acquired sole ownership of the Kerr Dam on the boundary of their reservation in September 2015, which was renamed Seli'š Ksanka Qlispe' plant.181,182 The Flathead Reservation, with its timber resources on the mountains and valleys of northwestern Montana, has the greatest biomass generation potential of all the tribal lands in the state.183,184
Endnotes
1 World Atlas, U.S. States by Size, accessed April 30, 2025.
2 Montana Public Radio, Why is Montana known as the ‘Big Sky State'?, August 17, 2022.
3 Montana Historical Society, This is Montana, Chapter 1, p. 2, accessed April 30, 2025.
4 World Atlas, Map of Montana, accessed May 28, 2025.
5 U.S. Energy Information Administration (EIA), State Energy Data System, Table P3, Total Primary Energy Production and Total Energy Consumption Estimates in Trillion Btu, 2022, Montana.
6 U.S. EIA, Montana Profile Overview, Interactive Map, Montana, accessed April 30, 2025.
7 U.S. EIA, Annual Coal Report (October 30, 2024), Table 15, Recoverable Coal Reserves at Producing Mines, Estimated Recoverable Reserves, and Demonstrated Reserve Base by Mining Method, 2023.
8 U.S. EIA, Lower 48 states shale plays, Map (June 30, 2016).
9 U.S. EIA, U.S. Crude Oil and Natural Gas Proved Reserves, Year-end 2022 (April 29, 2024), Table 6, Crude oil and least condensate proved reserves, reserves changes, by state and areas, 2022 (million barrels) and Table 8, Natural gas, wet after lease separation, proved reserves, reserves changes, by states and areas, 2022 (billion cubic feet).
10 NETSTATE, The Geography of Montana, accessed April 30, 2025.
11 U.S. Department of Interior, U.S. Geological Survey, Rivers of the World: World's Longest Rivers, accessed May 28, 2025.
12 Missouri Department of Natural Resources, Missouri River - PUB2018, updated March 1, 2014.
13 Montana Department of Environmental Quality, Montana Hydroelectric Resources, updated February 2022.
14 Northwestern Energy, Hydropower, accessed April 30, 2025.
15 North Carolina Institute for Climate Studies, NOAA National Centers for Environmental Information, State Climate Summaries 2022, Montana.
16 Montana Natural Resource Information System, Montana Average Daily Maximum Temperature 1971-2000, accessed April 30, 2025.
17 U.S. Department of Energy, Office of Energy Efficiency and Renewable Energy, WINDExchange, Wind Energy in Montana, Maps & Data, accessed April 30, 2025.
18 Montana State University, Wind Energy in Montana, accessed May 28, 2025.
19 U.S. Census, Population Density of the 50 States, the District of Columbia, and Puerto Rico: 1910 to 2020, p. 1.
20 Montana Department of Commerce, 2020 Decennial Census Redistricting Summary File (PL 94-171), Total for 2020 by State.
21 Montana Department of Commerce, Population, U.S. Census Bureau - Population Estimates Program, 2024, Trend.
22 GISGeography, Map of Montana - Cities and Roads, updated January 5, 2024.
23 U.S. Census Bureau, 2020 Census: Montana Profile, Population Density by Census Tract, accessed May 28, 2025.
24 National Agricultural Statistics Service, Montana Agricultural Facts 2024 (April 2025).
25 Montana Official State Website, Brief History of Montana, accessed May 1, 2025.
26 National Park Service, Find A Park, Montana, accessed May 1, 2025.
27 U.S. Bureau of Economic Analysis, Tools, Interactive Data, Regional Data, GDP and Personal Income, Annual Gross Domestic Product (GDP) by State, SAGDP2 GDP in current dollars, Montana, All statistics in table, 2023.
28 Bureau of Transportation Statistics, Montana - Transportation by the Numbers, p. 4, accessed May 28, 2025.
29 Montana Department of Commerce, Population, U.S. Census Bureau - Population Estimates Program, 2024, Rank, State.
30 U.S. EIA, State Energy Data System, Table C14, Total Energy Consumption Estimates per Capita by End-Use Sector, Ranked by State, 2022.
31 U.S. EIA, State Energy Data System, Table C11, Total Energy Consumption Estimates by End-Use Sector, Ranked by State, 2022.
32 U.S. EIA, State Energy Data System, Table C11, Total Energy Consumption Estimates by End-Use Sector, Ranked by State, 2022.
33 North Carolina Institute for Climate Studies, NOAA National Centers for Environmental Information, State Climate Summaries 2022, Montana, accessed May 28, 2025.
34 U.S. EIA, State Energy Data System, Table C14, Total Energy Consumption Estimates per Capita by End-Use Sector, Ranked by State, 2022.
35 U.S. EIA, Annual Coal Report (October 30, 2024), Table 15, Recoverable Coal Reserves at Producing Mines, Estimated Recoverable Reserves, and Demonstrated Reserve Base by Mining Method, 2023.
36 U.S. EIA, Quarterly Coal Report (April 2, 2025), Table 2, Coal Production by State (thousand short tons), 2023 and 2024.
37 U.S. EIA, Coal Data Browser, Number of mines for all coal, Montana, all mine statuses, 2023.
38 U.S. EIA, Annual Coal Report (October 30, 2024), Table 9, Major U.S. Coal Mines, 2023.
39 Westmoreland Mining LLC, Westmoreland Rosebud Mining LLC, Rosebud Mine, Montana, accessed May 1, 2025.
40 Talen Energy Corporation, Our Portfolio, Colstrip Steam Electric Station, accessed May 12, 2025.
41 U.S. EIA, Preliminary Monthly Electric Generator Inventory (based on Form EIA-860M as a supplement to Form EIA-860), Inventory of Operating Generators as of April 2025, Plant State: Montana, Technology: Conventional Steam Coal, and Inventory of Retired Generators as of April 2025, Plant State: Montana, Technology: Conventional Steam Coal.
42 U.S. EIA, Montana Electricity Profile 2023, Table 2A, available in XLSX format.
43 U.S. EIA, Annual Coal Distribution Report (October 30, 2024), Domestic distribution of U.S. coal by: Domestic and foreign distribution of U.S. coal by origin state, Montana, 2023.
44 Ghania, Yasmine, "U.S. states rely on B.C. to export thermal coal. Should the shipments be taxed?," CBC (March 12, 2025).
45 National Mining Association, U.S. Coal Exports by State of Origin 2018-2023 (Thousand Short Tons).
46 U.S. EIA, Annual Coal Distribution Report (October 30, 2024), Domestic distribution of U.S. coal by: Origin State, consumer, destination and method of transportation, Montana, Table OS-13: Domestic Coal Distribution, by Origin State, 2023.
47 U.S. EIA, Annual Coal Distribution Report (October 30, 2024), Domestic distribution of U.S. coal by: Domestic and foreign distribution of U.S. coal by origin state, Montana, 2023.
48 U.S. EIA, Quarterly Coal Report (April 2, 2025), Table 2, Coal Production by State (thousand short tons), 2023 and 2024.
49 U.S. EIA, "New solar plants expected to support most U.S. electric generation growth," Today in Energy (January 24, 2025).
50 Eggert, Amanda, "Wind power set to overtake coal generation capacity in Montana," Montana Free Press (December, 22, 2023).
51 U.S. EIA, "Planned retirements of U.S. coal-fired electric-generation capacity to increase in 2025," Today in Energy (February 25, 2025).
52 U.S. EIA, U.S. Crude Oil and Natural Gas Proved Reserves, Year-end 2022 (April 29, 2924), Table 6, Proved reserves, reserve changes, and production of crude oil and lease condensates, 2022.
53 U.S. EIA, Crude Oil Production, Annual, Thousand Barrels, Montana 2017-24.
54 Department of Natural Resources and Conservation of the State of Montana, Oil and Gas Conservation Division, Annual Review 2023, Volume 67, p. 2-1, 15-1.
55 U.S. EIA, Drilling Productivity Report, map, accessed May 13, 2025.
56 Sonnenberg, Stephen A. and Aris Pramudito, "Petroleum geology of the giant Elm Coulee field, Williston Basin," AAPG Bulletin (September 1, 2009).
57 Montana Department of Transportation, The Elm Coulee Oil Field, Birthplace of the Bakken Oil Boom, accessed May 13, 2025.
58 U.S. Geological Survey, "USGS Releases Oil and Gas Assessment for the Bakken and Three Forks Formations of Montana and North Dakota" Press Release (December 15, 2021).
59 U.S. EIA, Montana Field Production of Crude Oil, Annual, Thousand Barrels per Day, 1981-2024.
60 U.S. Department of Interior, U.S. Geological Survey, Assessment of Undiscovered Oil Resources in the Bakken and Three Forks Formations, Williston Basin Province, Montana, North Dakota, and South Dakota, 2013 (April 2013).
61 U.S. EIA, Petroleum & Other Liquids, Number and Capacity of Petroleum Refineries, Area: Montana, 2019-24.
62 Montana Petroleum Association, Montana Refining, Downstream Sector, accessed May 13, 2025.
63 U.S. EIA, Refinery Capacity Report (June 14, 2024), Table 3, Capacity of Operable Petroleum Refineries by State as of January 1, 2024.
64 Murray, David, "Calumet Montana oil refinery in Great Falls to become top US produced of sustainable jet fuel," Great Falls Tribune (February 4, 2023).
65 CHS Inc., Refined Fuels, accessed May 13, 2025.
66 Phillips 66 Co., Billings Refinery, accessed May 13, 2025.
67 Par Pacific Holdings, Inc., About Us, accessed May 13, 2025.
68 Calumet Specialty Products Partners, L.P., Facilities, Production, Blending, Packaging and Distribution Facilities, accessed May 13, 2025.
69 U.S. EIA, Montana Profile Overview, Interactive Map, Layer List: Pipelines and Transmission, Crude Oil Pipelines, accessed May 13, 2025.
70 U.S. EIA, State Energy Data System, Table C15, Petroleum Consumption Estimates, Total and per Capita, Ranked by State, 2022.
71 U.S. EIA, State Energy Data System, Table F16, Total Petroleum Consumption Estimates, 2023.
72 U.S. EIA, State Energy Data System, Table E20, Motor Gasoline Price and Expenditure Estimates, Ranked by State, 2022.
73 U.S. Department of Transportation, Federal Highway Administration, Office of Highway Policy Information, Highway Statistics 2023, Selected Measured for Identifying Peer States - 2023, Table PS-1.
74 Montana State Library, Map of Montana, accessed May 28, 2025.
75 Missoula County, Missoula Public Health, Oxygenated Fuels, accessed May 14, 2025.
76 U.S. Government Publishing Office, GovInfo, Federal Register Volume 90, Number 10 (Thursday, January 16, 2025), Air Plan Approval; Montana; Missoula, Montana Oxygenated Fuels Program Removal, Carbon Monoxide, Limited Maintenance Plan, Environmental Protection Agency.
77 U.S. EIA, U.S. Fuel Ethanol Plant Production Capacity (August 15, 2024), Detailed annual production capacity plant is available in XLSX.
78 U.S. EIA, Movements of Crude Oil and Selected Products by Rail between PAD Districts, Fuel Ethanol, Annual, 2018-24.
79 Voegele, Erin, "Montana Becomes 49th State To Approve The Sale of E15," Ethanol Producer Magazine (January 4, 2024).
80 U.S. Department of Energy, Alternative Fuels Data Center, Ethanol Basics, Blends, E15, accessed May 14, 2025.
81 U.S. EIA, State Energy Data System, Table F16, Total Petroleum Consumption Estimates, 2023.
82 U.S. Census Bureau, Tables, Table B25040, House Heating Fuel, Montana, 2023 American Community Survey 1-Year Estimates.
83 U.S. EIA, Electricity Data Browser, Net generation for all sectors (thousand megawatthours), Montana, Annual, 2001-24.
84 U.S. EIA, "Planned retirements of U.S. coal-fired electric-generating capacity to increase in 2025," Today in Energy (February 25, 2025).
85 U.S. EIA, "Renewable generation surpassed coal and nuclear in the U.S. electric power sector in 2022," Today in Energy (December 27, 2023).
86 U.S. EIA, "U.S. Henry Hub natural gas prices in 2023 were the lowest since mid-2020," Today in Energy (January 4, 2024).
87 U.S. EIA, Electricity Data Browser, Net generation for all sectors (thousand megawatthours), Montana, All fuels, Coal, Conventional hydroelectric, Annual, 2001-24.
88 Montana Department of Environmental Quality, Electricity Generation in Montana by Fuel, 1970-2019.
89 U.S. EIA, Electricity Data Browser, Net generation for all sectors (thousand megawatthours), Montana, Annual, 2001-24.
90 U.S. EIA, Electric Power Monthly (February 2025), Table 1.3.B, Table 1.10.B.
91 Montana Department of Environmental Quality, Electricity Generation in Montana by Fuel, 1970-2019.
92 U.S. EIA, Electricity Data Browser, Net generation for all sectors (thousand megawatthours), Montana, All fuels, Conventional hydroelectric, Annual, 2001-24.
93 U.S. EIA, "Western U.S. hydropower generation fell to a 22-year low last year," Today in Energy (March 26, 2024).
94 U.S. EIA, Montana Electricity Profile 2023, Table 2A, available in XLSX format.
95 NS Energy, Gordon Butte Pumped Storage Project, Montana, updated July 23, 2019.
96 U.S. EIA, "Most pumped storage electricity generators in the U.S. were built in the 1970s," Today in Energy (October 31, 2019).
97 U.S. EIA, Electricity Data Browser, Net generation for all sectors (thousand megawatthours), Montana, Annual, 2001-24.
98 U.S. EIA, Electric Power Monthly (February 2025), Table 1.3.B, Table 1.6.B.
99 U.S. Nuclear Regulatory Commission, Montana, updated March 9, 2021.
100 U.S. EIA, Montana Electricity Profile 2023, Table 10, available in XLSX format.
101 Montana Department of Environmental Quality, Understanding Energy in Montana 2023, p. 10, 53.
102 Montana Department of Environmental Quality, Understanding Energy in Montana 2023, p. 63-64.
103 Lutey, Tom, "Montana lands $700 million for major transmission project," Montana Free Press (August 6, 2024).
104 U.S. Department of Energy, Office of Electricity, Learn More About Interconnections, accessed May 15, 2025.
105 Montana Department of Environmental Quality, Montana's Electric Transmission Grid, accessed May 15, 2025.
106 Montana Department of Environmental Quality, Understanding Energy in Montana 2023, p. 59.
107 U.S. EIA, Electricity Data Browser, Retail sales of electricity (million kilowatthours), 2001-24.
108 U.S. Census Bureau, Tables, Table B25040, House Heating Fuel, Montana, 2023 American Community Survey 1-Year Estimates.
109 U.S. EIA, Electric Power Monthly (February 2025), Table 5.6.B.
110 U.S. EIA, Monthly Energy Review (May 2025), Appendix F monthly state file, XLS, Public Ports only and Public & Private Ports combined.
111 U.S. Department of Energy, Alternative Fuels Data Center, Electric Vehicle Charging Station Locations, Montana, accessed May 15, 2025.
112 U.S. EIA, State Energy Data System, Table F39, Electric light-duty vehicles overview, 2023.
113 U.S. EIA, Electricity Data Browser, Net generation for all sectors (thousand megawatthours), Montana, Annual, 2001-24.
114 U.S. EIA, Electric Power Monthly (February 2025), Table 1.3.B, Table 1.10.B, Table 1.11.B, Table 1.17.B.
115 New World Encyclopedia, Missouri River, accessed May 15, 2025.
116 Frommer's, The Lay of the Land in Montana, accessed May 15, 2025.
117 U.S. EIA, Electric Power Monthly (February 2025), Table 1.10.B.
118 Montana Department of Environmental Quality, Montana Hydroelectric Resources, updated February 2022.
119 U.S. EIA, Preliminary Monthly Electric Generator Inventory (based on Form EIA-860M as a supplement to Form EIA-860), Inventory of Operating Generators as of April 2025, Plant State: Montana, Technology: Conventional Hydroelectric.
120 U.S. EIA, Montana Electricity Profile 2023, Table 2B, available in XLSX format.
121 Montana Department of Environmental Quality, Understanding Energy in Montana 2023, p.27-31.
122 U.S. EIA, Preliminary Monthly Electric Generator Inventory (based on Form EIA-860M as a supplement to Form EIA-860), Inventory of Operating Generators as of April 2025, Plant State: Montana, Technology: Conventional Hydroelectric.
123 Montana Department of Environmental Quality, Understanding Energy in Montana 2023, p.31-34.
124 U.S. Department of Energy, Energy Efficiency and Renewable Energy, WINDExchange, Wind Energy in Montana, Maps & Data, accessed May 15, 2025.
125 U.S. Department of Energy, Energy Efficiency and Renewable Energy, WINDExchange, "Energy Department recognizes the first utility-scale wind project in Montana," Press Release (October 7, 2005).
126 U.S. EIA, Montana Electricity Profile 2023, Table 2A, Table 2B, available in XLSX format.
127 U.S. EIA, Preliminary Monthly Electric Generator Inventory (based on Form EIA-860M as a supplement to Form EIA-860), Inventory of Operating Generators as of April 2025, Plant State: Montana, Technology: Onshore Wind Turbine; Inventory of Planned Generators as of April 2025, Plant State: Montana, Technology: Onshore Wind Turbine, Batteries.
128 U.S. EIA, Electricity Data Browser, Net generation for all sectors (thousand megawatthours), Montana, Annual, 2001-24.
129 U.S. EIA, Preliminary Monthly Electric Generator Inventory (based on Form EIA-860M as a supplement to Form EIA-860), Inventory of Operating Generators as of April 2025, Plant State: Montana, Technology: Solar Photovoltaic.
130 National Renewable Energy Laboratory, Solid Biomass Resources in the United States, updated January 15, 2014.
131 U.S. Census Bureau, Tables, Table B25040, House Heating Fuel, Montana, 2023 American Community Survey 1-Year Estimates.
132 U.S. Census Bureau, Tables, Table B25040, House Heating Fuel, All States within United States, 2023 American Community Survey 1-Year Estimates.
133 U.S. EIA, Electricity Data Browser, Net generation for all sectors (thousand megawatthours), Montana, Annual, 2001-24.
134 U.S. EIA, Preliminary Monthly Electric Generator Inventory (based on Form EIA-860M as a supplement to Form EIA-860), Inventory of Operating Generators as of April 2025, Plant State: Montana, Technology: Wood/Wood Waste Biomass and Landfill Gas.
135 F.H. Stoltze Land & Lumber, Co-Generation Plant, accessed April 15, 2024.
136 Flathead Electric Cooperative, About My Co-op, How We Provide Power, Landfill Gas to Energy Plant, accessed May 15, 2025.
137 N.C. Clean Energy Technology Center, DSIRE, Montana Renewable Resource Standard, updated November 25, 2024.
138 Montana Renewable Energy Association, Utility Scale, accessed May 15, 2025.
139 National conference of State Legislatures, State Renewable Portfolio Standards and Goals, updated August 13, 2021.
140 Montana Department of Environmental Quality, Alternative Energy Revolving Loan Program, accessed May 15, 2025.
141 U.S. EIA, U.S. Crude Oil and Natural Gas Proved Reserves, Year-end 2022 (April 29, 2024), Table 10, Total natural gas proved reserves, reserves changes, and production, wet after lease separation, Data Series: Proved Reserves as of Dec 31, 2021.
142 U.S. EIA, Natural Gas Gross Withdrawals and Production, Marketed Production, Montana, 2019-24.
143 U.S. EIA, Montana Natural Gas Marketed Production, Annual, Monthly, 1967-2024.
144 U.S. EIA, Montana Natural Gas Gross Withdrawals from Coalbed Wells, Annual, 2002-23.
145 Montana Department of Natural Resources and Conservation, Board of Oil and Gas Conservation, Annual Review 2023, volume 67, p. 2-1, 3-1, 15-1.
146 Ramiro-Ramirez, Sebastian and Athma R. Bhandari, "Steady-State Liquid Permeability Measurements in Samples from the Bakken Formation, Williston Basin, USA," SPE Annual Technical Conference and Exhibition (September 2021), Figure 1.
147 U.S. EIA, Natural Gas Consumption by End Use, Total Consumption, Annual, 2019-23.
148 U.S. EIA, Natural Gas Gross Withdrawals and Production, Gross Withdrawals, Annual, 2019-24.
149 U.S. Department of Transportation, Pipeline and Hazardous Materials Safety Administration, Gas Transmission and Hazardous Liquid Pipelines, updated March 10, 2025.
150 Montana Department of Environmental Quality, Montana Natural Gas Resources, updated June 2022.
151 U.S. EIA, U.S. Natural Gas Imports by Point of Entry, 2019-24.
152 U.S. EIA, International and Interstate Movements of Natural Gas by State, Montana, Annual, 2018-23.
153 U.S. EIA, U.S. Natural Gas Imports by Point of Entry, 2019-24.
154 U.S. EIA, International and Interstate Movements of Natural Gas by State, Montana, Annual, 2018-23.
155 U.S. EIA, Underground Natural Gas Storage Capacity, Annual, 2018-23.
156 U.S. EIA, Natural Gas Annual Respondent Query System, 191 Field Level Storage Data (Annual), Total Field Capacity (Mcf), 2023, updated December 2024.
157 Montana Historical Society, This is Montana, Chapter 1, p. 6-7, accessed May 15, 2025.
158 U.S. EIA, State Energy Data System, Table C16, Natural Gas Consumption Estimates, Total and per Capita, Ranked by State, 2022.
159 U.S. EIA, Natural Gas Consumption by End Use, Montana, Annual, 2019-24.
160 U.S. Census Bureau, Tables, Table B25040, House Heating Fuel, Montana, 2023 American Community Survey 1-Year Estimates.
161 Native Land Information System, BIA Land Area Totals for US Native Lands, 2019 Native Land Area Data from the United States Bureau of Indian Affairs, Owner Source: Tribal, Filter by State: MT, accessed May 15, 2025.
162 U.S. Department of Agriculture, Montana Agricultural Facts 2024.
163 Montana State University, Indian Education for All, Tribal Territories in Montana, updated January 14, 2019.
164 U.S. Census Bureau, Tables, Table B02001 Race, Montana, 2023 American Community Survey 1-Year Estimates.
165 U.S. Department of the Interior, Indian Affairs, "Assistant Secretary Sweeney Clears the Path for Tribes to Develop Energy Resources on Tribal Land," Press Release (December 23, 2019).
166 U.S. EIA, U.S. Energy Atlas, All Energy Infrastructure and Resources, Montana, accessed May 15, 2025.
167 Gunderson, Jay A. and John Wheaton, Coal Resources of Montana, Montana Bureau of Mines and Geology, p. 2, accessed May 16, 2025.
168 Montana Governor's Office of Indian Affairs, Crow Nation, accessed May 16, 2025.
169 Mining Data Solutions, Absaloka Mine, accessed May 16, 2025.
170 Global Energy Monitor Wiki, Absaloka Cola Mine, accessed May 29, 2025.
171 Lopez, David A., Petroleum Geology of the Crow Indian Reservation, South-Central Montana (August 21, 2017), American Association of Petroleum Geologists, Abstract.
172 "Northern Cheyenne Tribe won't touch coal deposit despite economic woes," Indianz.com (June 27, 2017).
173 U.S. Department of the Interior, Bureau of Indian Affairs, Blackfeet Nation, Blackfeet Indian Reservation, Montana, Oil & Gas Development Opportunities, p. 3-4, accessed May 16, 2025.
174 Eggert, Amanda, "Solenex will retire last oil and gas lease in Badger-Two Medicine," Montana Free Press (September 1, 2023).
175 U.S. Department of the Interior, "Final Oil and Gas Lease to be Relinquished in Montana's Badge-Two Medicine Area," Press Release (September 1, 2023).
176 Montana Governor's Office of Indian Affairs, Blackfeet Nation, accessed May 16, 2025.
177 Groover, Heidi, "Prize and Poison," University of Montana (2011).
178 Montana Governor's Office of Indian Affairs, Fort Peck Assiniboine & Sioux Tribes, accessed May 16, 2025.
179 Milbrandt, Anelia, and Donna Heimiller, Techno-Economic Renewable Energy Potential on Tribal Lands (July 2018), National Renewable Energy Laboratory, Figure 2, Wind generation potential by reservation, p. 6; Table 6, Fifteen Tribal Lands with the Highest Technical Potential for Photovoltaic Electricity Generation, p. 11.
180 Milbrandt, Anelia, Donna Heimiller, and Paul Schwabe, Techno-Economic Renewable Energy Potential on Tribal Lands (July 2018), National Renewable Energy Laboratory, Table 18, Fifteen Tribal Lands with the Highest Technical Potential for Hydropower Generation, p. 33.
181 U.S. Department of Energy, Indian Energy Policy and Programs, Montana Tribes Realize Long-Held Vision of Acquiring Kerr Dam: Interview with Energy Keepers Inc. CEO Brian Lipscomb (September 16, 2015).
182 Montana Department of Environmental Quality, Understanding Energy in Montana 2023, p. 27-28.
183 Montana Governor's Office of Indian Affairs, Confederated Salish and Kootenai Tribes, accessed May 16, 2025.
184 Milbrandt, Anelia, Donna Heimiller, and Paul Schwabe, Techno-Economic Renewable Energy Potential on Tribal Lands (July 2018), National Renewable Energy Laboratory, Figure 9, Biopower generation potential by reservation (including extended areas of 10 miles adjacent to the tribal land boundaries), p. 19.
Other Resources
Energy-Related Regions and Organizations
- Coal Region: Western
- Petroleum Administration for Defense District (PADD): 4
- Regional Transmission Organization (RTO) and Independent System Operator (ISO): Midcontinent Independent System Operator (MISO), Southwest Power Pool (SPP), Western Power Pool (WPP)
- North American Electric Reliability Corporation (NERC) ERO Enterprise: Regional Entities: Midwest Reliability Organization (MRO), Western Electricity Coordinating Council (WECC)
Other Websites
- Montana Public Service Commission
- Montana Department of Public Health and Human Services, Low Income Home Energy, Water and Weatherization Assistance Programs
- Montana Department of Environmental Quality, Coal Mining
- Montana Department of Environmental Quality, Energy
- Montana Department of Natural Resources and Conservation, Board of Oil and Gas Conservation
- Montana Governor's Office of Indian Affairs
- Montana Department of Natural Resources and Conservation, Forest Products
- Montana Department of Natural Resources and Conservation, Renewable Resource Grants and Loans
- Montana Department of Environmental Quality (DEQ), Energy
- Montana Department of Environmental Quality (DEQ), Residential Energy Efficiency Rebates
- Energy Share of Montana
- EIA Montana Flickr Album
- Alternative Fuels Data Center, Federal and State Laws and Incentives
- USA.Gov, Get help with energy bills
- NC Clean Energy Technology Center, Database of State Incentives for Renewables and Efficiency (DSIRE)
- National Association of Regulatory Utility Commissioners (NARUC)
- National Association of State Energy Officials (NASEO)
- National Conference of State Legislatures (NCSL), Energy
- National Renewable Energy Laboratory (NREL), Geospatial Data Science Data and Tools
- U.S. Geological Survey (USGS), Publications
- U.S. Geological Survey (USGS), Maps
- Interstate Oil and Gas Compact Commission (IOGCC)
- Western Interstate Energy Board (WIEB)
- Western Area Power Administration (WAPA)
- Western Governors' Association
- Bonneville Power Administration (BPA)
- Northwest Power and Conservation Council, Power Supply
- U.S. Department of Health & Human Services, Office of Community Services, An Office of the Administration for Children & Families, Low Income Home Energy Assistance Program (LIHEAP)
- Lawrence Livermore National Laboratory (LLNL), Energy Flow Charts
- National Renewable Energy Laboratory (NREL), SLOPE: State and Local Planning for Energy
- U.S. Department of Energy, Office of Indian Energy Policy and Programs
- National Renewable Energy Laboratory, Decision Support for Tribes
- EIA Natural Gas Storage Dashboard
- EIA Energy Disruptions Maps
- U.S. Department of Agriculture (USDA), Rural Development Energy Programs