Missouri Quick Facts
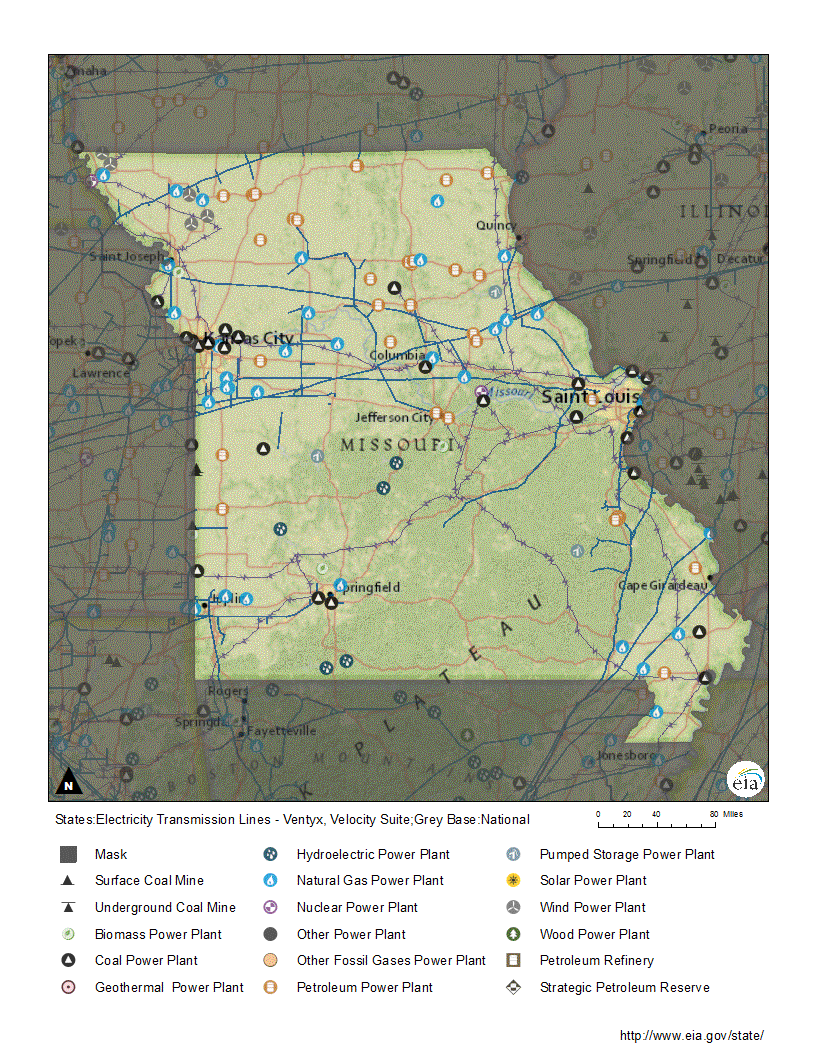
- The eastern and western sections of the Rockies Express Pipeline (REX), one of the nation’s longest natural gas pipelines, connect in northern Missouri.
- In 2022, coal provided 66% of Missouri's electricity net generation (including small-scale producers), the fourth-highest share of coal-fired generation for any state.
- Missouri uses nearly eight times more energy than it produces. The state ranks fifth in the nation in per capita energy consumption in the residential sector.
- Missouri is the second-largest biodiesel-producing state in the nation, with an output of 212 million gallons annually at 6 biodiesel plants.
- In 2022, renewable energy provided 12% of the state's total electricity net generation, exceeding 10% for the second year in a row. Wind power accounted for about three-fourths of the state's renewable-sourced electricity.
Last Updated: July 20, 2023
Data
Last Update: July 18, 2024 | Next Update: August 15, 2024
| Prices | |||||
|---|---|---|---|---|---|
| Petroleum | Missouri | U.S. Average | Period | find more | |
| Domestic Crude Oil First Purchase | -- | $ 83.16 /barrel | Apr-24 | ||
| Natural Gas | Missouri | U.S. Average | Period | find more | |
| City Gate | $ 3.21 /thousand cu ft | $ 3.43 /thousand cu ft | Apr-24 | find more | |
| Residential | $ 17.45 /thousand cu ft | $ 14.93 /thousand cu ft | Apr-24 | find more | |
| Coal | Missouri | U.S. Average | Period | find more | |
| Average Sales Price | W | $ 54.46 /short ton | 2022 | ||
| Delivered to Electric Power Sector | $ 1.79 /million Btu | $ 2.54 /million Btu | Apr-24 | ||
| Electricity | Missouri | U.S. Average | Period | find more | |
| Residential | 12.52 cents/kWh | 16.88 cents/kWh | Apr-24 | find more | |
| Commercial | 9.59 cents/kWh | 12.66 cents/kWh | Apr-24 | find more | |
| Industrial | 7.36 cents/kWh | 7.82 cents/kWh | Apr-24 | find more | |
| Reserves | |||||
|---|---|---|---|---|---|
| Reserves | Missouri | Share of U.S. | Period | find more | |
| Crude Oil (as of Dec. 31) | -- | -- | 2022 | find more | |
| Expected Future Production of Dry Natural Gas (as of Dec. 31) | -- | -- | 2022 | find more | |
| Expected Future Production of Natural Gas Plant Liquids | -- | -- | 2022 | find more | |
| Recoverable Coal at Producing Mines | NM | NM | 2022 | find more | |
| Rotary Rigs & Wells | Missouri | Share of U.S. | Period | find more | |
| Natural Gas Producing Wells | 3 wells | * | 2020 | find more | |
| Capacity | Missouri | Share of U.S. | Period | ||
| Crude Oil Refinery Capacity (as of Jan. 1) | 0 barrels/calendar day | 0.0% | 2023 | ||
| Electric Power Industry Net Summer Capacity | 21,172 MW | 1.8% | Apr-24 | ||
| Supply & Distribution | |||||
|---|---|---|---|---|---|
| Production | Missouri | Share of U.S. | Period | find more | |
| Total Energy | 217 trillion Btu | 0.2% | 2022 | find more | |
| Crude Oil | 0 thousand barrels per day | 0.0% | Apr-24 | find more | |
| Natural Gas - Marketed | 0 million cu ft | 0.0% | 2022 | find more | |
| Coal | 74 thousand short tons | * | 2022 | find more | |
| Total Utility-Scale Net Electricity Generation | Missouri | Share of U.S. | Period | find more | |
| Total Net Electricity Generation | 4,614 thousand MWh | 1.5% | Apr-24 | ||
| Utility-Scale Net Electricity Generation (share of total) | Missouri | U.S. Average | Period | ||
| Petroleum-Fired | 0.3 % | 0.3 % | Apr-24 | find more | |
| Natural Gas-Fired | 11.3 % | 39.5 % | Apr-24 | find more | |
| Coal-Fired | 49.0 % | 12.0 % | Apr-24 | find more | |
| Nuclear | 19.1 % | 18.5 % | Apr-24 | find more | |
| Renewables | 20.1 % | 29.3 % | Apr-24 | ||
| Stocks | Missouri | Share of U.S. | Period | find more | |
| Motor Gasoline (Excludes Pipelines) | 112 thousand barrels | 1.0% | Apr-24 | ||
| Distillate Fuel Oil (Excludes Pipelines) | 653 thousand barrels | 0.7% | Apr-24 | find more | |
| Natural Gas in Underground Storage | 12,513 million cu ft | 0.2% | Apr-24 | find more | |
| Petroleum Stocks at Electric Power Producers | NM | NM | Apr-24 | find more | |
| Coal Stocks at Electric Power Producers | 8,051 thousand tons | 5.9% | Apr-24 | find more | |
| Fueling Stations | Missouri | Share of U.S. | Period | ||
| Motor Gasoline | 2,638 stations | 2.4% | 2021 | ||
| Propane | 47 stations | 2.0% | Jun-24 | ||
| Electric Vehicle Charging Locations | 1,033 stations | 1.6% | Jun-24 | ||
| E85 | 135 stations | 3.1% | Jun-24 | ||
| Biodiesel, Compressed Natural Gas, and Other Alternative Fuels | 33 stations | 1.1% | Jun-24 | ||
| Consumption & Expenditures | |||||
|---|---|---|---|---|---|
| Summary | Missouri | U.S. Rank | Period | ||
| Total Consumption | 1,733 trillion Btu | 19 | 2022 | find more | |
| Total Consumption per Capita | 374 million Btu | 13 | 2022 | find more | |
| Total Expenditures | $ 30,586 million | 20 | 2022 | find more | |
| Total Expenditures per Capita | $ 5,985 | 16 | 2022 | find more | |
| by End-Use Sector | Missouri | Share of U.S. | Period | ||
| Consumption | |||||
| » Residential | 513 trillion Btu | 2.6% | 2022 | find more | |
| » Commercial | 384 trillion Btu | 2.3% | 2022 | find more | |
| » Industrial | 294 trillion Btu | 0.9% | 2022 | find more | |
| » Transportation | 544 trillion Btu | 2.0% | 2022 | find more | |
| Expenditures | |||||
| » Residential | $ 6,422 million | 1.9% | 2022 | find more | |
| » Commercial | $ 4,018 million | 1.7% | 2022 | find more | |
| » Industrial | $ 3,254 million | 1.1% | 2022 | find more | |
| » Transportation | $ 16,892 million | 2.0% | 2022 | find more | |
| by Source | Missouri | Share of U.S. | Period | ||
| Consumption | |||||
| » Petroleum | 122 million barrels | 1.7% | 2022 | find more | |
| » Natural Gas | 316 billion cu ft | 1.0% | 2022 | find more | |
| » Coal | 31,940 thousand short tons | 6.2% | 2022 | find more | |
| Expenditures | |||||
| » Petroleum | $ 19,410 million | 1.8% | 2022 | find more | |
| » Natural Gas | $ 3,612 million | 1.3% | 2022 | find more | |
| » Coal | $ 1,104 million | 4.1% | 2022 | find more | |
| Consumption for Electricity Generation | Missouri | Share of U.S. | Period | find more | |
| Petroleum | 31 thousand barrels | 2.0% | Apr-24 | find more | |
| Natural Gas | 4,886 million cu ft | 0.5% | Apr-24 | find more | |
| Coal | 1,363 thousand tons | 6.4% | Apr-24 | find more | |
| Energy Source Used for Home Heating (share of households) | Missouri | U.S. Average | Period | ||
| Natural Gas | 48.8 % | 46.2 % | 2022 | ||
| Fuel Oil | 0.2 % | 3.9 % | 2022 | ||
| Electricity | 39.2 % | 41.3 % | 2022 | ||
| Propane | 8.4 % | 5.0 % | 2022 | ||
| Other/None | 3.6 % | 3.5 % | 2022 | ||
| Environment | |||||
|---|---|---|---|---|---|
| Renewable Energy Capacity | Missouri | Share of U.S. | Period | find more | |
| Total Renewable Energy Electricity Net Summer Capacity | 3,038 MW | 0.9% | Apr-24 | ||
| Ethanol Plant Nameplate Capacity | 332 million gal/year | 1.9% | 2023 | ||
| Renewable Energy Production | Missouri | Share of U.S. | Period | find more | |
| Utility-Scale Hydroelectric Net Electricity Generation | 108 thousand MWh | 0.6% | Apr-24 | ||
| Utility-Scale Solar, Wind, and Geothermal Net Electricity Generation | 886 thousand MWh | 1.2% | Apr-24 | ||
| Utility-Scale Biomass Net Electricity Generation | 6 thousand MWh | 0.2% | Apr-24 | ||
| Small-Scale Solar Photovoltaic Generation | 72 thousand MWh | 0.9% | Apr-24 | ||
| Fuel Ethanol Production | 7,220 thousand barrels | 2.0% | 2022 | ||
| Renewable Energy Consumption | Missouri | U.S. Rank | Period | find more | |
| Renewable Energy Consumption as a Share of State Total | 5.9 % | 35 | 2022 | ||
| Fuel Ethanol Consumption | 7,529 thousand barrels | 15 | 2022 | ||
| Total Emissions | Missouri | Share of U.S. | Period | find more | |
| Carbon Dioxide | 117.0 million metric tons | 2.4% | 2021 | ||
| Electric Power Industry Emissions | Missouri | Share of U.S. | Period | find more | |
| Carbon Dioxide | 57,147 thousand metric tons | 3.5% | 2022 | ||
| Sulfur Dioxide | 87 thousand metric tons | 8.1% | 2022 | ||
| Nitrogen Oxide | 45 thousand metric tons | 3.7% | 2022 | ||
Analysis
Last Updated: July 20, 2023
Overview
Missouri is a transportation hub for the United States at the junction of the nation's two longest rivers, the Missouri and the Mississippi.1 The state's infrastructure and location give shippers the ability to move raw materials and agricultural and manufactured products by rail, river, highway, and air to destinations across the country.2,3 Missouri has little fossil fuel production, but it does have fossil fuel resources, including coal deposits and petroleum-bearing tar sands and oil shales.4,5,6,7
The rich soils of the plains, the rolling hills north of the Missouri River, and the southeastern lowlands form the state's fertile agricultural regions.8,9 Missouri's large corn and soybean crops are feedstocks for the state's biofuels industry.10,11 South of the Missouri River, the heavily forested Ozark Plateau has abundant biomass resource potential, and the open prairies of northern and western Missouri have the state's best wind resources.12,13,14 Three of the largest earthquakes in U.S. history were centered in southeastern Missouri.15 The potential for further tremors in that geologically active part of the state is taken into consideration in siting nuclear power plants throughout the Midwest.16,17
Missouri ranks fifth in the nation in per capita energy consumption in the residential sector.
Missouri has a moderate climate, and extended periods of very cold or very hot weather are uncommon.18 The state's total energy consumption per capita is close to the midpoint of the states. However, the state ranks fifth in the nation in per capita energy consumption in the residential sector.19 Missouri consumes almost eight times more energy than it produces.20 The transportation and residential sectors are the two largest energy-consuming end-use sectors, with each accounting for about three-tenths of the state's total energy use. The commercial sector accounts for slightly more than one-fifth of Missouri's energy consumption. The industrial sector—which includes manufacturing, construction, agriculture, and mining—accounts for about one-sixth of the state's energy consumption.21,22
Petroleum
Missouri’s crude oil production increased in 2022 for the first time since 2013.
Missouri does not have significant crude oil reserves. The state's crude oil production has mostly been in decline since 2014, although annual oil output increased in 2022 for the first time in nearly a decade, rising to 67,000 barrels. However, production was still down significantly from its peak of 285,000 barrels in 1984.23 The first crude oil production in the state came from wells drilled near Kansas City, Missouri, in the late 1860s. Today, crude oil is still produced in western Missouri near the state's border with Kansas and Nebraska, and also in eastern Missouri near St. Louis. Cass County, in western Missouri, just south of Kansas City, is the source of 6 out of every 10 barrels of crude oil produced in the state.24,25
Six major crude oil pipelines pass through Missouri on their way to refining centers elsewhere in the Midwest.26 The last petroleum refinery in the state closed in 1982.27,28 Missouri receives finished petroleum products from several interstate pipelines, most of which originate along the Gulf Coast.29 Some petroleum products also arrive at the state's inland ports by barge on the Missouri and Mississippi Rivers.30,31,32
Missouri's petroleum consumption per capita is slightly below the national average.33 Three-fifths of the state's petroleum consumption is in the form of motor gasoline.34 Missouri is one of only two Midwestern states—the other is Minnesota—that require statewide use of motor gasoline with at least 10% ethanol.35,36 In order to reduce emissions, the St. Louis and Kansas City metropolitan areas have stricter motor gasoline requirements than the rest of the state.37 Few Missouri residents use heating oil for home heating, but about 1 in every 11 state households depend on propane for their primary heating fuel.38 In addition, Missouri is a top 10 corn-producing state, and, in wet years, propane is used to dry the corn crop after the harvest.39,40
Coal
Missouri holds 1.5% of U.S. economically recoverable coal reserves, but the state's coal production is small and accounts for less than 0.1% of U.S. total coal output. The state has one operating surface mine that produces a minor amount of coal for industrial use.41 All of Missouri's mined coal is bituminous, which has a high heat content when burned and is used to generate electricity and to make iron and steel.42,43 Nearly all of the state's mined coal is sent out of the state by truck and rail to industrial plants in Kansas.44,45 Missouri has a rich coal mining history dating back to the 1880s, but coal production declined significantly from a high of 6.7 million tons in 1984 to about 74,000 tons in 2022.46,47,48
In 2022, about 31 million short tons of coal were burned for electricity generation in Missouri, the second-most in any state, only behind Texas.49 Nearly all the coal that fuels Missouri's coal-fired power plants comes by rail from Wyoming. Minor amounts of coal also arrive by rail from Illinois. Additional small amounts of coal from Illinois, Colorado, and Indiana are delivered by river barges, rail, and trucks to industrial and commercial users in the state.50
Natural gas
Missouri has no major economically recoverable natural gas reserves, and except for a few private wells in the northwest corner of the state, commercial production of natural gas has ceased. In 2022, Missouri's natural gas output totaled less than 1 million cubic feet.51,52,53 One-third of Missouri, about 24,000 square miles, lies on top of coal seams that potentially could produce coalbed methane. Those coal deposits are located in the northern and western areas of the state.54,55,56
The eastern and western sections of the Rockies Express Pipeline (REX), one of the nation’s longest natural gas pipelines, connect in northern Missouri.
Missouri is crossed by about a dozen interstate natural gas pipelines.57,58 Natural gas enters the state from the west and south, mostly by way of Kansas, Arkansas, Nebraska, and Oklahoma. Most of that natural gas continues on to Illinois and Iowa for delivery to markets in the Midwest and beyond.59 The eastern and western sections of the Rockies Express Pipeline (REX), one of the nation's largest and longest natural gas pipelines, connect in northern Missouri. The REX pipeline's western section originates in Colorado and brings Rocky Mountain natural gas east. The pipeline's eastern section is bidirectional and can bring to Missouri natural gas that is produced from shale areas in Ohio and Pennsylvania.60,61 Some of the natural gas that enters Missouri is injected into the state's one underground natural gas storage field, which is located near St. Louis. It can hold almost 14 billion cubic feet of gas.62,63,64
Missouri's residential sector, where about one-third of households use natural gas as their primary energy source for heating, consumes more than one-third of the natural gas delivered to end users in the state.65,66 The commercial, electric power, and industrial sectors each account for about one-fifth of the state's natural gas consumption. A small amount of natural gas is used as vehicle fuel in the state's transportation sector.67
Electricity
Missouri has the fourth-highest share of in-state electricity generated from coal.
In 2022, coal fueled 66% of Missouri's electricity net generation, and 8 of the 10 largest power plants in the state are coal-fired.68,69 Missouri ranks fourth, behind West Virginia, Wyoming, and Kentucky, for the highest share of in-state electricity net generation from coal.70 However, coal's share of the state's net generation has declined from a peak of 81% in 2010, as 1,400 megawatts of coal-fired generating capacity in Missouri were retired since 2011, including 510 megawatts in late 2022 at the Meramec generating station located south of St. Louis.71,72,73,74
In 2022, Missouri's one nuclear facility, the Callaway nuclear power plant located west of St. Louis, accounted for 11% of in-state generation. The plant's generation declined sharply in 2021 because of multiple unplanned shutdowns, which resulted in both natural gas and wind-powered generation to surpass nuclear power for the first time. However, natural gas and wind energy dropped back below nuclear power generation in 2022, with each accounting for about 9% of the state's power output.75,76 Hydropower accounted for about 2% of total in-state generation, while solar, petroleum, and biomass accounted for the rest.77
On an annual basis, Missouri typically uses more electricity than it generates and imports power from other states via the regional grid.78 Electric utilities provide almost all of the electricity generated in Missouri.79 There are also about 40 electric cooperatives that serve customers in just about every county in the state.80 However, most of the state's population is concentrated in urban areas—mainly St. Louis and Kansas City—and receives power from investor-owned utilities.81 The residential sector uses the most electricity in the state, accounting for almost half of total power sales.82 Missouri's average electricity price is below the national average and its residential sector price is among the lowest one-fourth of the states.83 About 4 out of 10 Missouri households rely on electricity as their primary energy source for home heating, and just about every household has electric air conditioning equipment.84,85
Missouri currently has about 1,100 public charging stations for electric vehicles, with nearly 2,400 EVSE (Electric Vehicle Supply Equipment) ports (DC Fast and Level 2). The majority of charging stations are located in and around St. Louis and Kansas City, although many charging stations can also be found along the state's major highways.86 The Missouri Department of Natural Resources is looking to expand its charging station network through both public and private investments.87
Renewable energy
In 2022, renewable sources accounted for 12% of Missouri's total in-state electricity net generation from both utility-scale (1 megawatt or larger capacity) and small-scale installations (less than 1 megawatt capacity), marking the second year in a row that renewable electricity's share exceeded 10%. Missouri's primary renewable electricity sources are wind energy and hydropower. Wind energy provided about three-fourths of the state's renewable generation and hydropower accounted for about one-seventh. Solar and biomass provided the remainder.88
At the beginning of 2023, Missouri had about 2,100 megawatts of wind power generating capacity that provided 77% of the in-state renewable electricity. 89,90 In 2022, Missouri ranked 18th in the nation in wind power generation.91 The best wind energy resources are located in the northwest corner of the state, known as the northern plains.92,93
Missouri had 550 megawatts of conventional hydropower generating capacity that provided about 15% of the state's renewable net generation in 2022. The state's seven conventional hydroelectric power plants were built between 1930 and 1984, and are located on the tributaries of the Missouri and Mississippi Rivers.94,95 Missouri also has three pumped-storage hydroelectric plants with about 660 megawatts of combined capacity. The pumped-storage power plants generate electricity during peak demand periods by using water pumped into an upper reservoir in off-peak periods and then releasing it to flow back to a lower reservoir when additional generating capacity is needed. Power is generated as the water flows through turbines located between the reservoirs. Although the plants use more power than they generate, the plants supply cheaper power in periods of peak demand when electricity prices are highest.96,97
The amount of electricity generated from utility-scale (1 megawatt or larger) and small-scale (less than 1 megawatt) solar photovoltaic (PV) installations in the state has more than tripled since 2018, and generated 7% of the state's renewable electricity in 2022.98 More than three-fourths of the state's solar power comes from customer-sited, small-scale generating systems, many of which are installed on rooftops at both businesses and homes.99 A Missouri utility announced in early 2023 that it plans to buy what will be the state's largest solar farm, the 200-megawatt Huck Finn solar project, which is expected to be online in late 2024. The solar farm will be located about 75 miles northwest of St. Louis.100
A small amount of the state's renewable electricity generation comes from biomass, mostly wood.101 Missouri has significant biomass potential from agricultural waste, municipal solid waste, landfill gas, and the 15 million acres of forest that cover roughly one-third of the state.102,103 Electricity net generation from biomass has remained stable over the last five years and accounted for 1% of the state's renewable electricity in 2022.104 Missouri's forests and biomass resources also provide feedstock for the state's wood pellet industry. The state has three wood pellet manufacturing plants with a combined production capacity of about 157,000 tons per year.105 That state offers a wood energy production tax credit that provides a state income tax credit of $5 for each ton of wood pellets manufactured.106 Wood pellets are used as fuel for generating electricity and for space heating.107
Missouri ranks second in the nation in biodiesel production.
Missouri produces significant amounts of both biodiesel and fuel ethanol. The state is the second-largest biodiesel producer in the nation—about 212 million gallons annually at 6 biodiesel plants.108,109 The biodiesel plants use mostly soy oil or animal fats as feedstocks.110 Missouri's biodiesel consumption of 32 million gallons is among the top one-fourth of the states.111 The state is the 13th-largest fuel ethanol producer. Its six ethanol manufacturing plants use corn as a feedstock to produce 273 million gallons of ethanol a year.112,113,114,115 Missouri ranks among the top one-third of states in fuel ethanol consumption and used 312 million gallons in 2021.116
Some of Missouri's large pig farms provide methane from manure lagoons that is converted into renewable natural gas (RNG). This RNG is then delivered by pipeline to cities and towns in the state.117,118
In 2008, Missouri voters approved a mandatory renewable portfolio standard (RPS) to replace a voluntary goal. The RPS required investor-owned electric utilities to meet 15% of their electricity sales with power generated from renewable sources by 2021 and each year thereafter. The standard also required that solar power account for at least 0.3% of total electricity retail sales by 2021. State regulators implemented cost caps to keep electricity retail rates from rising more than 1% in any year because of the mandate.119 Since 2007, Missouri has required all electricity suppliers to offer net metering to residents with customer-sited renewable electricity generating systems up to 100 kilowatts in capacity, with the value of excess generation sent to the grid credited to the customer's next bill.120
Endnotes
1 Missouri Department of Transportation, A Vision for Missouri's Freight Transportation Future, accessed June 12, 2023.
2 U.S. Geological Survey, Rivers of the World: World's Longest Rivers, June 11, 2018.
3 Missouri Department of Economic Development, Why Missouri?, accessed June 12, 2023.
4 U.S. Energy Information Administration (EIA), Crude Oil Production, Annual-Thousand Barrels, Missouri, View History, 1981-2022.
5 U.S. EIA, Natural Gas Gross Withdrawals and Production, Gross Withdrawals, Annual-Million Cubic Feet, Missouri, 2017-22.
6 Missouri Department of Natural Resources, Missouri Geological Survey, Geology, Oil and Gas in Missouri, accessed June 12, 2023.
7 U.S. EIA, Annual Coal Report (October 18, 2022), Table 15, Recoverable Coal Reserves at Producing Mines, Estimated Recoverable Reserves, and Demonstrated Reserve Base by Mining Method, 2021.
8 Missouri Department of Agriculture, Missouri Ag Highlights, accessed June 12, 2023.
9 Missouri Department of Natural Resources, Division of Geology and Land Survey, Physiographic Regions of Missouri - PUB2515, August, 26, 2021.
10 U.S. EIA, U.S. Fuel Ethanol Plant Production Capacity (August 8, 2022), Detailed annual production capacity by plant is available in XLS.
11 U.S. EIA, U.S. Biodiesel Plant Production Capacity (August 8, 2022), Detailed annual production capacity by plant is available in XLS format.
12 U.S. Department of Energy, Benefits of Biofuel Production and Use in Missouri, September 2015.
13 University of Missouri Extension, Woody Biomass for Energy in Missouri, accessed June 12, 2023.
14 U.S. Department of Energy, Energy Efficiency and Renewable Energy, WINDExchange, Wind Energy in Missouri, Maps & Data, accessed June 12, 2023.
15 Missouri Department of Natural Resources, Earthquakes in Missouri, accessed June 12, 2023.
16 U.S. Geological Survey, The New Madrid Seismic Zone, accessed June 12, 2023.
17 U.S. Nuclear Regulatory Commission, Background on Seismic Reviews at U.S. Nuclear Power Plants, updated June 13, 2018.
18 Decker, Wayne L., "Climate of Missouri," Missouri Climate Center, accessed June 12, 2023.
19 U.S. EIA, State Energy Data System, Table C14, Energy Consumption Estimates per Capita by End-Use Sector, Ranked by State, 2021.
20 U.S. EIA, State Energy Data System, Table P3, Total Primary Energy Production and Total Energy Consumption Estimates in Trillion Btu, 2021.
21 U.S. EIA, State Energy Data System, Table C11, Energy Consumption Estimates by End-Use Sector, Ranked by State, 2021.
22 U.S. Bureau of Economic Analysis, Regional Data, GDP & Personal Income, Annual Gross Domestic Product (GDP) by State, GDP in Current Dollars, Classification, NAICS, Missouri, All statistics in table, Area Missouri, 2022.
23 U.S. EIA, Missouri Field Production of Crude Oil, Annual-Thousand Barrels, 1981-2022.
24 Missouri Department of Natural Resources, Oil and Gas in Missouri-PUB0652 (November 1, 2016).
25 Missouri Department of Natural Resources, Annual Oil Production Figures, 2022 Annual Oil Production Figures, updated March 30, 2023.
26 Missouri Department of Transportation, Missouri Pipeline System, accessed June 13, 2023.
27 "Amoco to close Sugar Creek refinery," UPI (March 3, 1982).
28 U.S. EIA, Number and Capacity of Petroleum Refineries, Total Number of Operable Refineries, Annual (as of January 1), 2017-22.
29 Pipeline 101, Where Are Liquids Pipelines Located? accessed June 13, 2023.
30 Missouri Port Authority, Welcome to Our Waterways, accessed June 13, 2023.
31 World Port Source, Port of Kansas City, accessed June 13, 2023.
32 World port Source, Port of Metropolitan St. Louis, accessed June 13, 2023.
33 U.S. EIA, State Energy Data System, Table C15, Petroleum Consumption, Total and per Capita, Ranked by State, 2021.
34 U.S. EIA, State Energy Data System, Table C2, Energy Consumption Estimates for Major Energy Sources in Physical Units, 2021.
35 Missouri Department of Agriculture, The Missouri Renewable Fuel Standard Act, accessed June 13, 2023.
36 U.S. EIA, Frequently Asked Questions (FAQS), How much ethanol is in gasoline, and how does it affect fuel economy?, updated May 1, 2023.
37 Larson, B. K., U.S. Gasoline Requirements, ExxonMobil (January 2018).
38 U.S. Census Bureau, House Heating Fuel, Table B25040, 2021 ACS 1-Year Estimates Detailed Tables, Missouri.
39 U.S. EIA, "Propane Use for Crop Drying Depends on Weather and Corn Markets as well as Crop Size," Today in Energy, (October 2, 2014).
40 Missouri Department of Agriculture, Missouri Ag Highlights, accessed June 13, 2023.
41 U.S. EIA, Annual Coal Report (October 18, 2022), Table 15, Recoverable Coal Reserves at Producing Mines, Estimated Recoverable Reserves, and Demonstrated Reserve Base by Mining Method, 2021; Table 1, Coal Production and Number of Mines by State and Mine Type, 2021 and 2020.
42 U.S. EIA, Annual Coal Report (October 18, 2022), Table 6, Coal Production and Number of Mines by State and Coal Rank, 2021.
43 U.S. EIA, Energy Explained, Coal Explained, Types of Coal, Bituminous, accessed June 14, 2023.
44 U.S. EIA, Annual Coal Report (October 18, 2022), Table 6, Coal Production and Number of Mines by State and Coal Rank, 2021.
45 U.S. EIA, Annual Coal Distribution Report (October 18, 2022), Domestic distribution of U.S. coal by origin State, Missouri, Table OS-13, Domestic Coal Distribution, by Origin State, 2021.
46 Missouri Department of Natural Resources, Missouri Coal, p. 3-4, updated January 1, 2020.
47 U.S. EIA, Quarterly Coal Report (April 3, 2023), Table 2, Coal production by state (thousand short tons).
48 U.S. EIA, State Energy Production Estimates 1960 Through 2021, Table PT1, Primary Energy Production Estimates in Physical Units, Missouri, 1960-2021, p. 64.
49 U.S. EIA, Electricity Data Browser, Total consumption for all sectors, annual (thousand tons), 2001-22.
50 U.S. EIA, Annual Coal Distribution Report (October 18, 2022), Domestic distribution of U.S. coal by destination State, Missouri, Table DS-21, Domestic Coal Distribution, by Destination State, 2021.
51 U.S. EIA, U.S. Crude Oil and Natural Gas Proved Reserves, Year-end 2021, Table 10, Total natural gas proved reserves, reserves changes, and production, wet after lease separation, 2021.
52 U.S. EIA, Natural Gas Gross Withdrawals and Production, Gross Withdrawals, Annual-Million Cubic Feet, Monthly-Million Cubic Feet, 1991-2023.
53 Missouri Department of Natural Resources, Annual Oil Production Figures, Annual Gas Production (MCF), updated March 30, 2023.
54 Missouri Department of Natural Resources, Missouri Coal, p. 3, updated January 1, 2020.
55 Missouri Department of Natural Resources, Division of Geology and Land Survey, Oil and Gas in the Show-Me State, The Geologic Column of Missouri, Volume 2, Issue 1 (Summer 2007), p. 2, 4.
56 U.S. Department of Energy, Missouri Natural Gas Flaring and Venting Regulations (May 2019).
57 Interstate Natural Gas Association of America, Map, accessed June 15, 2023.
58 Missouri Public Service Commission, Missouri Natural Gas Pipelines, updated July 12, 2018.
59 U.S. EIA, International and Interstate Movements of Natural Gas by State, Missouri, 2016-21.
60 Tallgrass Energy, Rockies Express Pipeline map, updated June 7, 2023.
61 U.S. EIA, Natural Gas Weekly Update, "Rex Zone 3 capacity expansion enters full service, increasing Northeast takeaway capacity," (January 11, 2017).
62 U.S. EIA, Underground Natural Gas Storage Capacity, Total Number of Existing Fields, 2016-21.
63 U.S. EIA, Underground Natural Gas Storage Capacity, Total Storage Capacity, 2016-21.
64 IndustryNet, Spire Missouri Inc., Lange Underground Storage Reservoir, accessed June 15, 2023.
65 U.S. EIA, Natural Gas Consumption by End Use (million cubic feet), Annual, Missouri, 2017-22.
66 U.S. Census Bureau, House Heating Fuel, Table B25040, 2021 ACS 1-Year Estimates Detailed Tables, Missouri.
67 U.S. EIA, Natural Gas Consumption by End Use (million cubic feet), Annual, Missouri, 2017-22.
68 U.S. EIA, Electricity Data Browser, Net generation for all sectors, annual (thousand megawatthours), Missouri, 2019-22.
69 U.S. EIA, Missouri Electricity Profile 2021, Table 2A, Ten largest plants by capacity, 2021.
70 U.S. EIA, Electric Power Monthly (February 2023), Tables, 1.3.B., 1.4.B., 1.17.B.
71 U.S. EIA, Electricity Data Browser, Net generation for all sectors, annual (thousand megawatthours), Missouri, 2001-22.
72 U.S. EIA, "Coal will account for 85% of U.S. electric generating capacity retirements in 2022," Today in Energy (January 11, 2022).
73 Gray, Bryce, "Ameren's oldest, smallest coal plant set to retire — raising questions about its afterlife," St. Louis Post-Dispatch (December 29, 2022).
74 U.S. EIA, Electricity, Preliminary Monthly Electric Generator Inventory (based on Form EIA-860M as a supplement to Form EIA-860), Inventory of Retired Generators as of May 2023, Plant State: Missouri, Technology: Conventional Steam Coal.
75 U.S. EIA, Electricity Data Browser, Net generation for all sectors (thousand megawatthours), Missouri, 2019-22.
76 "After 2 months, Callaway nuclear plant remains shut down," AP News, March 4, 2021.
77 U.S. EIA, Electricity Data Browser, Net generation for all sectors (thousand megawatthours), Missouri, 2019-22.
78 U.S. EIA, Missouri Electricity Profile 2021, Table 10, Supply and disposition of electricity, 1990 through 2021, Missouri.
79 U.S. EIA, Electric Power Monthly (February 2023), Table 1.3.B.
80 Association of Missouri Electric Cooperatives, Our Co-ops, accessed June 16, 2023.
81 Missouri Public Service Commission, Missouri Electric Service Areas (November 8, 2019).
82 U.S. EIA, Electricity Data Browser, Retail sales of electricity (million kilowatthours), Missouri, 2019-22.
83 U.S. EIA, Electric Power Monthly (February 2023), Table 5.6.B.
84 U.S. Census Bureau, House Heating Fuel, Table B25040, 2021 ACS 1-Year Estimates Detailed Tables, Missouri.
85 U.S. EIA, Residential Energy Consumption Survey (RECS), 2020 RECS Survey Data, Highlights for air conditioning in U.S. homes by state, 2020.
86 U.S. Department of Energy, Alternative Fuels Data Center, Alternative Fueling Station Finder, Missouri, accessed June 16, 2023.
87 Missouri Department of Natural Resources, Electric Vehicle Charging Stations, accessed June 16, 2023.
88 U.S. EIA, Electricity Data Browser, Net generation for all sectors (thousand megawatthours), Missouri, 2019-22.
89 U.S. EIA, Electric Power Monthly, Table 6.2.B.
90 U.S. EIA, Electricity Data Browser, Net generation for all sectors (thousand megawatthours), Missouri, 2019-22.
91 U.S. EIA, Electric Power Monthly (February 2023), Table 1.14.B.
92 U.S. Department of Energy, Energy Efficiency and Renewable Energy, WINDExchange, Wind Energy in Missouri, Maps & Data, accessed June 16, 2023.
93 Missouri Department of Natural Resources, Wind, accessed June 16, 2023.
94 U.S. EIA, Electricity, Preliminary Monthly Electric Generator Inventory (based on Form EIA-860M as a supplement to Form EIA-860), Inventory of Operating Generators as of May 2023, Plant State: Missouri, Technology: Conventional Hydroelectric.
95 U.S. EIA, Electricity Data Browser, Net generation for all sectors (thousand megawatthours), Missouri, 2019-22.
96 U.S. EIA, Electricity, Preliminary Monthly Electric Generator Inventory (based on Form EIA-860M as a supplement to Form EIA-860), Inventory of Operating Generators as of May 2023, Plant State: Missouri, Technology: Hydroelectric Pumped Storage.
97 U.S. EIA, "Pumped storage provides grid reliability even with net generation loss," Today in Energy (July 8, 2013).
98 U.S. EIA, Electricity Data Browser, Net generation for all sectors (thousand megawatthours), Missouri, 2001-22.
99 U.S. EIA, Electricity Data Browser, Net generation for all sectors (thousand megawatthours), Missouri, 2019-22.
100 Ameren Missouri, "Ameren Missouri expanding solar generation in Show-Me State with largest project in company history," Press Release (February 8, 2023).
101 U.S. EIA, Electricity Data Browser, Net generation for all sectors (thousand megawatthours), Missouri, 2019-22.
102 Missouri Department of Conservation, Missouri Forest Facts, By the Numbers, accessed June 18, 2023.
103 Missouri Department of Natural Resources, Biomass, accessed June 18, 2023.
104 U.S. EIA, Electricity Data Browser, Net generation for all sectors (thousand megawatthours), Missouri, 2019-22.
105 U.S. EIA, Monthly Densified Biomass Fuel Report (July 3, 2023), Table 1, Densified biomass fuel manufacturing facilities in the United States by state, region, and capacity, April 2023.
106 NC Clean Energy Technology Center, DSIRE, Missouri, Wood Energy Production Credit, updated March 8, 2023.
107 U.S. EIA, "New EIA survey collects data on production and sales of wood pellets," Today in Energy (December 14, 2016).
108 U.S. EIA, State Energy Data System, Table P4B, Primary Energy Production Estimates, Biofuels, in Thousand Barrels, Ranked by State 2021.
109 U.S. EIA, U.S. Biodiesel Plant Production Capacity (August 8, 2022), Detailed annual production capacity by plant is available in XLS format.
110 Missouri Department of Natural Resources, Division of Energy, Biofuels, Biodiesel, accessed June 18, 2023.
111 U.S. EIA, State Energy Data System, Table F26, Biodiesel Consumption Estimates, 2021.
112 U.S. EIA, State Energy Data System, Table P4B, Primary Energy Production Estimates, Biofuels, in Thousand Barrels, Ranked by State 2021.
113 U.S. EIA, U.S. Fuel Ethanol Plant Production Capacity (August 8, 2022), Detailed nameplate capacity of fuel ethanol plants by Petroleum Administration for Defense District (PADD District) are available in XLS.
114 U.S. Ethanol Plants, Operational, Ethanol Producer Magazine (April 26, 2023).
115 Missouri Department of Natural Resources, Division of Energy, Biofuels, accessed June 18, 2023.
116 U.S. EIA, State Energy Data System, Table F25, Fuel ethanol consumption estimates, 2021.
117 Gay, Bryce, "Manure-to-energy' projects on Missouri pig farms attract fresh $45 million investment," St. Louis Post-Dispatch (February 20, 2020).
118 Smithfield Foods, Inc., "Largest Renewable Natural Gas Project of Its Kind Implements Manure-to-Energy Technology Across Northern Missouri, Celebrates Construction Completion Ahead of Joint Venture's 10-Year Anniversary," (August 11, 2021).
119 NC Clean Energy Technology Center, DSIRE, Missouri, Renewable Energy Standard, updated November 3, 2022.
120 NC Clean Energy Technology Center, DSIRE, Missouri, Net Metering, updated March 23, 2023.
Other Resources
Energy-Related Regions and Organizations
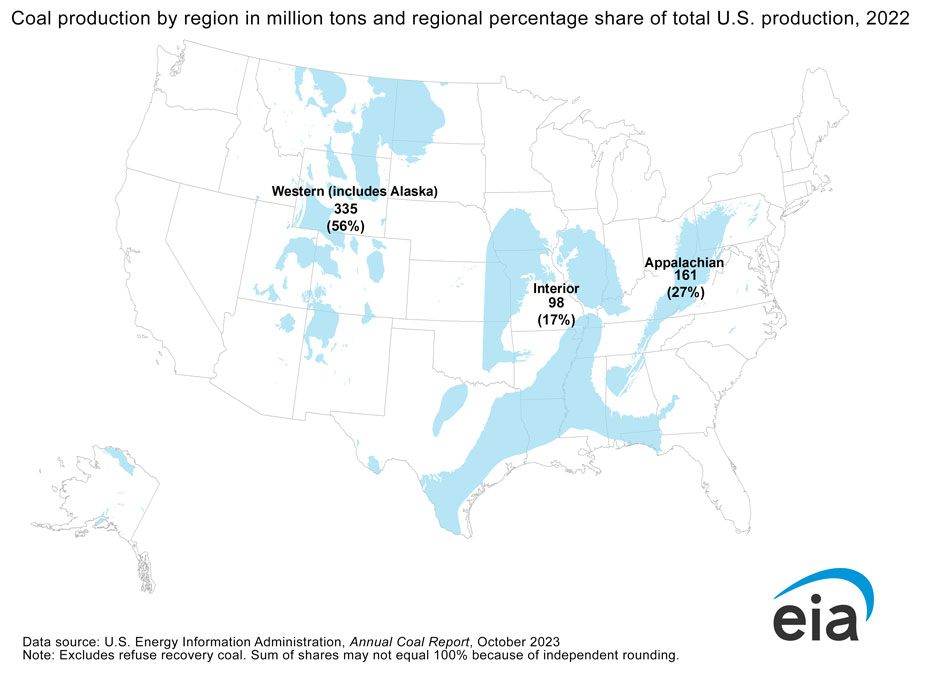
- Coal Region: Interior
- Petroleum Administration for Defense District (PADD): 2
- Regional Transmission Organization (RTO) and Independent System Operator (ISO): Midcontinent Independent System Operator (MISO), Southwest Power Pool (SPP)
- North American Electric Reliability Corporation (NERC) ERO Enterprise: Regional Entities: SERC Reliability Corporation (SERC)
Other Websites
- Missouri Department of Natural Resources, Division of Energy
- Missouri Public Service Commission
- Missouri Department of Social Services - Low Income Home Energy Assistance Program
- Missouri Department of Natural Resources, Division of Energy, Low-Income Weatherization Assistance Program (LIWAP)
- Missouri Department of Natural Resources - State Oil and Gas Council
- Missouri Environmental Improvement and Energy Resources Authority
- Missouri Department of Natural Resources - Missouri Mining Commission
- Missouri Department of Natural Resources, Energy Efficiency
- Missouri Petroleum Storage Tank Insurance Fund
- Missouri Propane Safety Commission
- Southern States Energy Board
- EIA Missouri Flickr Album
- Alternative Fuels Data Center, Federal and State Laws and Incentives
- Benefits.Gov, Housing and Public Utilities
- NC Clean Energy Technology Center, Database of State Incentives for Renewables and Efficiency (DSIRE)
- National Association of Regulatory Utility Commissioners (NARUC)
- National Association of State Energy Officials (NASEO)
- National Conference of State Legislatures (NCSL), Research and Policy
- National Renewable Energy Laboratory (NREL), Geospatial Data Science Data and Tools
- U.S. Geological Survey (USGS), Publications
- Interstate Oil and Gas Compact Commission (IOGCC)
- Southwestern Power Administration
- U.S. Department of Health & Human Services, Office of Community Services, An Office of the Administration for Children & Families, Low Income Home Energy Assistance Program (LIHEAP)
- U.S. Geological Survey, Maps
- Lawrence Livermore National Laboratory, Energy Flow Charts
- National Renewable Energy Laboratory, State and Local Planning for Energy (SLOPE)
- EIA Status of U.S. Nuclear Outages
- EIA Natural Gas Storage Dashboard
- EIA Energy Disruptions
- U.S. Department of Agriculture (USDA), Rural Development, Energy Programs