Maryland Quick Facts
- Maryland's per capita petroleum consumption is the fourth lowest among the states, and the transportation sector uses about 8 out of every 10 barrels of petroleum consumed in Maryland.
- Baltimore is the nation’s second-largest coal exporting port after Norfolk, Virginia. In 2022, about one-fifth of U.S. coal exports left through Baltimore.
- In 2022, Maryland's only nuclear power plant--the Calvert Cliffs power station--accounted for 39% of the state's total electricity net generation.
- Maryland ranks among the 10 states with the lowest per capita natural gas use. The electric power sector is the state's top natural gas-consuming sector and in 2022 consumed a record amount of natural gas.
- Maryland’s legislature enacted a law in 2022 to further reduce the state’s greenhouse gas emissions 60% from 2006 levels by 2031 and reach a net-zero emissions level by 2045.
Last Updated: December 21, 2023
Data
Last Update: July 18, 2024 | Next Update: August 15, 2024
| Prices | |||||
|---|---|---|---|---|---|
| Petroleum | Maryland | U.S. Average | Period | find more | |
| Domestic Crude Oil First Purchase | -- | $ 83.16 /barrel | Apr-24 | ||
| Natural Gas | Maryland | U.S. Average | Period | find more | |
| City Gate | $ 5.01 /thousand cu ft | $ 3.43 /thousand cu ft | Apr-24 | find more | |
| Residential | $ 14.77 /thousand cu ft | $ 14.93 /thousand cu ft | Apr-24 | find more | |
| Coal | Maryland | U.S. Average | Period | find more | |
| Average Sales Price | $ 75.71 /short ton | $ 54.46 /short ton | 2022 | ||
| Delivered to Electric Power Sector | W | $ 2.54 /million Btu | Apr-24 | ||
| Electricity | Maryland | U.S. Average | Period | find more | |
| Residential | 17.85 cents/kWh | 16.88 cents/kWh | Apr-24 | find more | |
| Commercial | 12.57 cents/kWh | 12.66 cents/kWh | Apr-24 | find more | |
| Industrial | 10.08 cents/kWh | 7.82 cents/kWh | Apr-24 | find more | |
| Reserves | |||||
|---|---|---|---|---|---|
| Reserves | Maryland | Share of U.S. | Period | find more | |
| Crude Oil (as of Dec. 31) | -- | -- | 2022 | find more | |
| Expected Future Production of Dry Natural Gas (as of Dec. 31) | -- | -- | 2022 | find more | |
| Expected Future Production of Natural Gas Plant Liquids | -- | -- | 2022 | find more | |
| Recoverable Coal at Producing Mines | 9 million short tons | 0.1% | 2022 | find more | |
| Rotary Rigs & Wells | Maryland | Share of U.S. | Period | find more | |
| Natural Gas Producing Wells | NA | NA | 2020 | find more | |
| Capacity | Maryland | Share of U.S. | Period | ||
| Crude Oil Refinery Capacity (as of Jan. 1) | 0 barrels/calendar day | 0.0% | 2023 | ||
| Electric Power Industry Net Summer Capacity | 11,956 MW | 1.0% | Apr-24 | ||
| Supply & Distribution | |||||
|---|---|---|---|---|---|
| Production | Maryland | Share of U.S. | Period | find more | |
| Total Energy | 216 trillion Btu | 0.2% | 2022 | find more | |
| Crude Oil | -- | -- | Apr-24 | find more | |
| Natural Gas - Marketed | 5 million cu ft | * | 2022 | find more | |
| Coal | 1,228 thousand short tons | 0.2% | 2022 | find more | |
| Total Utility-Scale Net Electricity Generation | Maryland | Share of U.S. | Period | find more | |
| Total Net Electricity Generation | 3,445 thousand MWh | 1.1% | Apr-24 | ||
| Utility-Scale Net Electricity Generation (share of total) | Maryland | U.S. Average | Period | ||
| Petroleum-Fired | 0.9 % | 0.3 % | Apr-24 | find more | |
| Natural Gas-Fired | 43.4 % | 39.5 % | Apr-24 | find more | |
| Coal-Fired | 2.6 % | 12.0 % | Apr-24 | find more | |
| Nuclear | 38.7 % | 18.5 % | Apr-24 | find more | |
| Renewables | 13.7 % | 29.3 % | Apr-24 | ||
| Stocks | Maryland | Share of U.S. | Period | find more | |
| Motor Gasoline (Excludes Pipelines) | -- | -- | Apr-24 | ||
| Distillate Fuel Oil (Excludes Pipelines) | 764 thousand barrels | 0.9% | Apr-24 | find more | |
| Natural Gas in Underground Storage | 56,924 million cu ft | 0.8% | Apr-24 | find more | |
| Petroleum Stocks at Electric Power Producers | 522 thousand barrels | 2.3% | Apr-24 | find more | |
| Coal Stocks at Electric Power Producers | 702 thousand tons | 0.5% | Apr-24 | find more | |
| Fueling Stations | Maryland | Share of U.S. | Period | ||
| Motor Gasoline | 1,449 stations | 1.3% | 2021 | ||
| Propane | 27 stations | 1.1% | Jun-24 | ||
| Electric Vehicle Charging Locations | 1,660 stations | 2.6% | Jun-24 | ||
| E85 | 44 stations | 1.0% | Jun-24 | ||
| Biodiesel, Compressed Natural Gas, and Other Alternative Fuels | 7 stations | 0.2% | Jun-24 | ||
| Consumption & Expenditures | |||||
|---|---|---|---|---|---|
| Summary | Maryland | U.S. Rank | Period | ||
| Total Consumption | 1,203 trillion Btu | 28 | 2022 | find more | |
| Total Consumption per Capita | 195 million Btu | 44 | 2022 | find more | |
| Total Expenditures | $ 24,773 million | 26 | 2022 | find more | |
| Total Expenditures per Capita | $ 4,019 | 49 | 2022 | find more | |
| by End-Use Sector | Maryland | Share of U.S. | Period | ||
| Consumption | |||||
| » Residential | 371 trillion Btu | 1.9% | 2022 | find more | |
| » Commercial | 351 trillion Btu | 2.1% | 2022 | find more | |
| » Industrial | 87 trillion Btu | 0.3% | 2022 | find more | |
| » Transportation | 395 trillion Btu | 1.4% | 2022 | find more | |
| Expenditures | |||||
| » Residential | $ 6,185 million | 1.9% | 2022 | find more | |
| » Commercial | $ 5,159 million | 2.1% | 2022 | find more | |
| » Industrial | $ 1,353 million | 0.5% | 2022 | find more | |
| » Transportation | $ 12,076 million | 1.4% | 2022 | find more | |
| by Source | Maryland | Share of U.S. | Period | ||
| Consumption | |||||
| » Petroleum | 83 million barrels | 1.1% | 2022 | find more | |
| » Natural Gas | 299 billion cu ft | 0.9% | 2022 | find more | |
| » Coal | 2,545 thousand short tons | 0.5% | 2022 | find more | |
| Expenditures | |||||
| » Petroleum | $ 14,167 million | 1.3% | 2022 | find more | |
| » Natural Gas | $ 3,479 million | 1.3% | 2022 | find more | |
| » Coal | $ 191 million | 0.7% | 2022 | find more | |
| Consumption for Electricity Generation | Maryland | Share of U.S. | Period | find more | |
| Petroleum | 77 thousand barrels | 4.9% | Apr-24 | find more | |
| Natural Gas | 10,697 million cu ft | 1.2% | Apr-24 | find more | |
| Coal | 45 thousand tons | 0.2% | Apr-24 | find more | |
| Energy Source Used for Home Heating (share of households) | Maryland | U.S. Average | Period | ||
| Natural Gas | 43.3 % | 46.2 % | 2022 | ||
| Fuel Oil | 6.6 % | 3.9 % | 2022 | ||
| Electricity | 43.9 % | 41.3 % | 2022 | ||
| Propane | 3.8 % | 5.0 % | 2022 | ||
| Other/None | 2.4 % | 3.5 % | 2022 | ||
| Environment | |||||
|---|---|---|---|---|---|
| Renewable Energy Capacity | Maryland | Share of U.S. | Period | find more | |
| Total Renewable Energy Electricity Net Summer Capacity | 1,457 MW | 0.4% | Apr-24 | ||
| Ethanol Plant Nameplate Capacity | -- | -- | 2023 | ||
| Renewable Energy Production | Maryland | Share of U.S. | Period | find more | |
| Utility-Scale Hydroelectric Net Electricity Generation | 289 thousand MWh | 1.5% | Apr-24 | ||
| Utility-Scale Solar, Wind, and Geothermal Net Electricity Generation | 300 thousand MWh | 0.4% | Apr-24 | ||
| Utility-Scale Biomass Net Electricity Generation | 26 thousand MWh | 0.7% | Apr-24 | ||
| Small-Scale Solar Photovoltaic Generation | 143 thousand MWh | 1.8% | Apr-24 | ||
| Fuel Ethanol Production | 0 thousand barrels | 0.0% | 2022 | ||
| Renewable Energy Consumption | Maryland | U.S. Rank | Period | find more | |
| Renewable Energy Consumption as a Share of State Total | 4.0 % | 45 | 2022 | ||
| Fuel Ethanol Consumption | 5,707 thousand barrels | 23 | 2022 | ||
| Total Emissions | Maryland | Share of U.S. | Period | find more | |
| Carbon Dioxide | 52.6 million metric tons | 1.1% | 2021 | ||
| Electric Power Industry Emissions | Maryland | Share of U.S. | Period | find more | |
| Carbon Dioxide | 11,240 thousand metric tons | 0.7% | 2022 | ||
| Sulfur Dioxide | 3 thousand metric tons | 0.3% | 2022 | ||
| Nitrogen Oxide | 5 thousand metric tons | 0.4% | 2022 | ||
Analysis
Last Updated: December 21, 2023
Overview
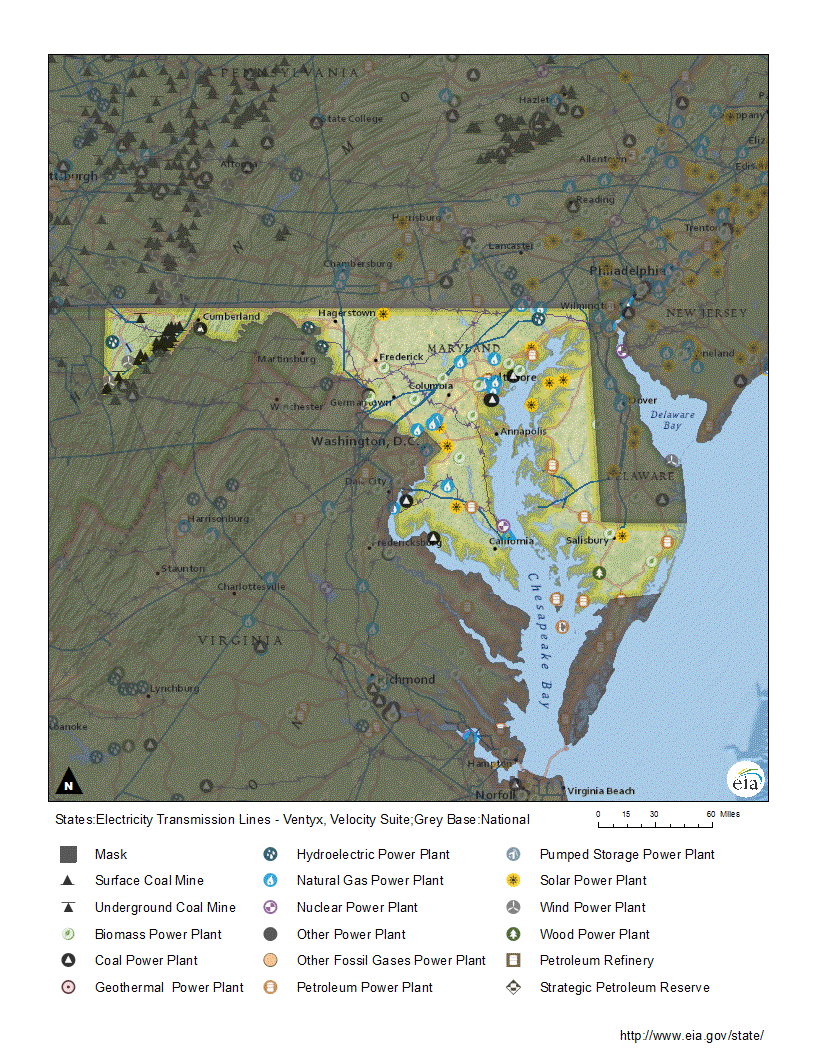
Maryland wraps around the Chesapeake Bay and extends west into the Appalachian region, where the state's only fossil fuel reserves—coal and natural gas—are found.1 Baltimore, the state's largest city and one of the 20 largest ports in the nation, handles both coal and petroleum products.2,3 Maryland's renewable energy resources—hydropower, solar, wind, and biomass—are distributed widely throughout the state.4 Maryland is the seventh most densely populated state in the nation with 636 people per square mile. The state's population is concentrated in the center of the state in an area that stretches from the northeastern Baltimore suburbs southwest to the suburbs of Washington, DC.5,6 Maryland's western mountains and low-lying southern and eastern plains are largely rural and lightly populated.7 East of the Chesapeake Bay, in an area known as the Eastern Shore, the land is flat with many wetlands, and the nearby Atlantic Ocean adds humidity and moderates the weather year-round. On the western side of the Bay, the land rises from the coastal plain through rolling foothills to the mountain ranges of the Appalachians.8 Precipitation is fairly evenly distributed throughout the year and across the state, but, as the land rises to the west, temperatures generally decline and annual snowfall levels increase during the winter.9 The state's coastal areas average less than 4 inches of snow annually, while parts of the western mountains average more than 100 inches.10
Maryland consumes about five times more energy than it produces.
Maryland consumes about five times more energy than it produces.11 In 2021, the transportation sector accounted for 33% of the state's energy consumption, followed closely by the residential sector at 31% and the commercial sector at 29%. The industrial sector accounted for 7% of the energy used in Maryland. Maryland ranks among the 10 states with both the lowest total per capita energy consumption and the lowest energy use to produce one dollar of GDP.12,13,14 Major contributors to the state's GDP include: government spending; finance, insurance, and real estate; professional and business services; education and healthcare; and construction.15
Petroleum
Maryland has no economically recoverable crude oil reserves or production, and there are no petroleum refineries in the state.16,17,18 Some petroleum products arrive in Maryland by pipeline from other states and by ship from abroad. The Colonial Pipeline runs through Maryland on its way from the Gulf Coast to the New York City metropolitan area and delivers refined products to terminals in the state, including gasoline, diesel fuel, home heating oil, and jet fuel.19 Baltimore's deep-water port receives tankers carrying petroleum products from other countries.20,21
Maryland's total per capita petroleum consumption is the fourth lowest among the states, after New York, Rhode Island, and Massachusetts.22 About 8 out of every 10 barrels of petroleum used in Maryland are consumed by the transportation sector.23 The state requires the use of reformulated motor gasoline blended with ethanol to reduce smog-forming pollutants across the densely populated Baltimore-Washington corridor in the center of the state. Counties in the mountain west and much of the rural Eastern Shore are not required to use reformulated motor gasoline, although two counties on Maryland's Eastern Shore have opted to require the fuel.24,25 The industrial and residential sectors each account for about 5% of the state's petroleum consumption, and the commercial sector uses about 4%. A small amount of petroleum is used to generate electricity.26 About 1 in 10 Maryland households use heating oil, propane, or kerosene for heating.27
Natural gas
Maryland has few economically recoverable natural gas reserves, and the state produces very little natural gas.28,29 There are a few low-production wells in far western Maryland that collectively produce about 5 million cubic feet of natural gas annually.30,31 The state's two westernmost counties—Garrett and Allegany—overlie part of the natural gas-rich Marcellus Shale and have some recoverable natural gas reserves.32 However, in 2017, Maryland enacted a permanent ban on the use of hydraulic fracturing in natural gas and crude oil production.33
Maryland's natural gas needs are met by supplies that enter the state by way of several interstate pipelines and a liquefied natural gas (LNG) port. Major pipelines transport natural gas to the state from the nation's Gulf Coast and Southwest via Virginia. Increasing amounts of natural gas enter Maryland from the north through Pennsylvania, as that state's shale gas production continues to grow. Maryland's Eastern Shore also receives natural gas from Pennsylvania by pipeline through Delaware.34,35 About four-fifths of the natural gas that enters Maryland continues on to Virginia, the District of Columbia, or is liquefied for export to other countries.36
A small amount of natural gas enters the state at the LNG import terminal at Cove Point, Maryland, on the Chesapeake Bay's western shore. Cove Point is one of a dozen operating LNG import facilities in the United States.37,38 The terminal is connected by pipeline to several major interstate natural gas pipeline systems.39 Maryland's LNG imports from other countries decreased substantially during the past decade in response to increased U.S. natural gas production.40,41,42 With U.S. natural gas production rising, Cove Point became the second LNG export terminal operating in the United States in early 2018, and by late 2023 it was one of eight in the country.43,44
In 2022, Maryland’s electric power sector consumption of natural gas reached a record high.
Maryland ranks among the 10 states with the lowest per capita natural gas use.45 The electric power sector became Maryland's top natural gas-consuming sector for the first time in 2018. In 2022, the sector consumed a record amount of natural gas and accounted for about 36% of the state's natural gas use. Natural gas-fired electricity generation in the state has tripled since 2015.46,47 The residential sector made up 30% of Maryland's natural gas consumption in 2022, followed by the commercial sector at 27% and the industrial sector at about 6%. A minor amount of natural gas is used in the state's transportation sector.48 About 4 out of 10 Maryland households use natural gas as their primary fuel for home heating.49
Coal
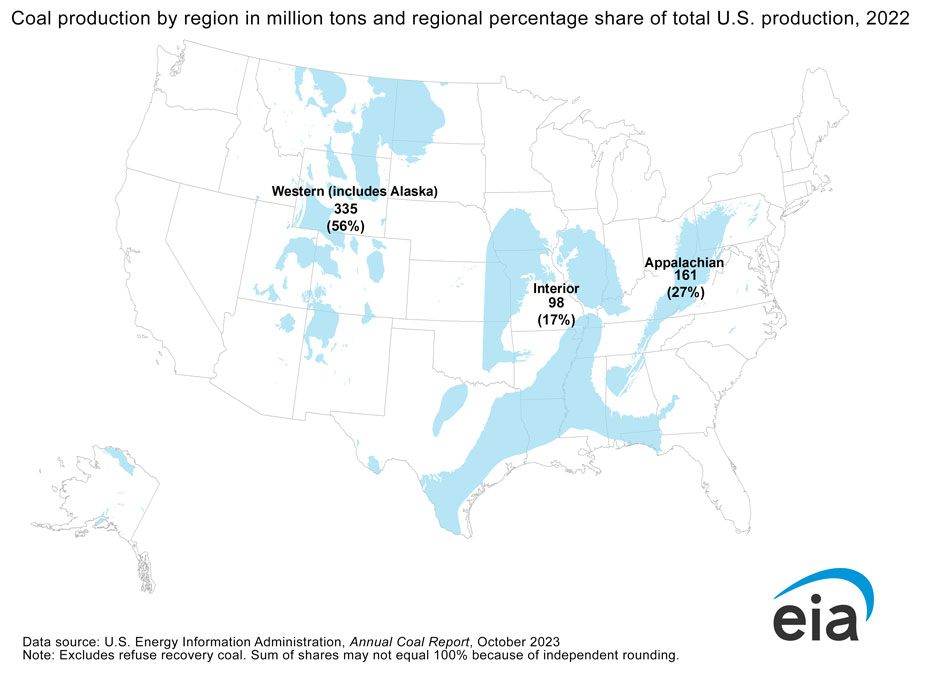
Maryland holds about 0.1% of the nation's estimated recoverable coal reserves and accounts for about 0.3% of U.S. coal production.50,51 The state has 1 underground and 13 surface coal mines, all of them located in the Appalachian Basin in the state's western counties.52,53 Slightly more than half of Maryland's coal stays within the state and most of it is consumed at power plants. Almost all the rest is sent to West Virginia, where that coal is also used at electric power plants. A minor amount of Maryland coal is sent to Pennsylvania for use in steelmaking, and a small amount of coal is exported to other countries.54,55
Overall, coal-fired power plants use about four-fifths of the coal consumed in Maryland, and industrial plants use the rest. Pennsylvania provides about 53% of the coal consumed in Maryland, and almost all the rest comes from Maryland's coal mines. Most of Pennsylvania's coal arrives in Maryland by rail and truck, and Maryland coal is delivered within the state by truck. There are also minor coal shipments from West Virginia, Kentucky, and Ohio that arrive by rail and truck.56
Baltimore is the second-largest U.S. coal exporting port.
Coal is the leading export commodity by tonnage at the Port of Baltimore, the nation's second-largest coal export center after Norfolk, Virginia. In 2022, about one-fifth of the nation's coal exports left through Baltimore.57,58,59 Steam coal, which is burned to generate electricity, accounted for almost three-fifths of Baltimore's coal exports, and metallurgical coal, which is used in steelmaking, made up the rest.60 The Port of Baltimore historically received a small amount of imported coal each year, but it handled no coal imports in 2021 and 2022.61
Electricity
Nuclear energy and natural gas supplied 75% of Maryland’s total electricity net generation in 2022.
In 2022, nuclear energy and natural gas generated 75% of Maryland's total in-state electricity, with each supplying almost equal amounts of the power supply. Maryland's only nuclear power plant—the two-reactor Calvert Cliffs power plant located on the western shore of the Chesapeake Bay—accounted for about 39% of the state's total net generation.62,63 Natural gas-fired generation has more than tripled since 2015, as nearly 2,600 megawatts of new natural gas-fired generating capacity came online. Natural gas accounted for about 36% of in-state electricity generation in 2022.64,65
Coal-fired generating plants historically supplied more than half the state's net generation, but coal's share has been below 50% since 2012 and was at 12% in 2022.66 As of mid-2023, there were four generating units at Maryland's three remaining coal-fired power plants with a combined generating capacity of nearly 1,800 megawatts. The two largest power plants intend to stop burning coal by 2025 and the smallest plant will end its coal use in mid-2024.67,68 Solar energy, hydropower, wind, and biomass accounted for most of the state's remaining net generation in 2022.69 Since 2015, almost all of the state's new generating capacity has been natural gas-fired or solar-powered.70
Maryland uses less electricity per capita than about four-fifths of the states, but it uses about 40% more electricity than it generates, and the extra supply is delivered to the state over the regional grid.71,72,73 The residential sector accounted for about 47% of Maryland's electricity use in 2022, followed closely by the commercial sector at 46%. About 4 in 10 Maryland households use electricity as their primary heating source.74,75 The industrial sector accounted for 6% of the state's electricity consumption, and the transportation sector, consisting of railways and subway and light-rail systems in the Maryland suburbs of Washington, DC and in Baltimore, made up about 1%.76 Maryland had about 70,500 registered electric vehicles and about 1,300 electric charging stations by May 2023.77 The state provides financial incentives for consumers to purchase electric vehicles and for the installation of charging stations.78
Renewable energy
In 2022, solar power accounted for the largest share of Maryland’s renewable electricity generation for the first time.
Renewable energy, including both small-scale generating installations (less than 1 megawatt) and utility-scale generating facilities (1 megawatt or larger), provided 12% of Maryland's total in-state electricity in 2022. Solar power accounted for the largest share for the first time, slightly more than two-fifths, of the state's renewable electricity generation.79 Solar powered-generation more than quadrupled from 2015 to 2022. Nearly two-thirds of the state's solar generation came from small-scale, customer-sited solar photovoltaics (PV), such as rooftop solar panels, and the rest of the generation was at larger utility-scale solar farms.80 By mid-2023, Maryland had about 1,550 megawatts of total solar generating capacity installed.81 The state's largest solar facility—located on the Eastern Shore—came online in late 2022 with a generating capacity of 80 megawatts.82
Hydropower provided almost two-fifths of the state's renewable electricity generation in 2022.83 The Conowingo hydroelectric generating station, located in northern Maryland on the Susquehanna River, was the second-largest hydroelectric power plant ever built, after the Niagara Falls generating station, when it began operating nearly a century ago. The 11 turbines at the station have a combined generating capacity of 572 megawatts.84,85 Conowingo provides almost all of Maryland's generation from hydroelectricity and it is one of the state's top 10 power plants based on both generating capacity and actual annual generation.86
Wind energy provided slightly more than one-tenth of Maryland's renewable electricity generation in 2022.87 The state's best onshore wind resources are in its western mountains and along its southern Chesapeake Bay and Atlantic Ocean shorelines.88 The state's only operating utility-scale wind farms are along Maryland's western Appalachian Mountain crests, where 190 megawatts of generating capacity is installed.89 Maryland's greatest wind energy potential is offshore.90
Four major wind projects are in development off Maryland's Atlantic coastline. The MarWin wind project, located about 18 miles offshore in federal waters, will feature 22 turbines that will reach a blade tip height of about 900 feet, which is taller than the Washington Monument. Collectively, the turbines can generate up to 248 megawatts of electricity, and the project is scheduled to come online in 2026.91,92,93,94 The Momentum Wind Project, with 55 turbines and 809 megawatts of capacity, is planned 15 miles off the Maryland coast and is expected to be operational in 2026.95,96 The federal Bureau of Ocean Energy Management released for public comment in October 2023 an environmental impact statement on the two projects, a key step in the federal review and approval process.97 The Skipjack wind project, expected to come online in late 2026, is planned for two areas about 20 miles offshore from the Maryland-Delaware state line and have a combined generating capacity of nearly 1,000 megawatts from 69 wind turbines. All of Skipjack's generated electricity will be sent to Maryland.98,99,100,101
Biomass fueled about 7% of Maryland's renewable electricity in 2022, including at facilities that use landfill gas, municipal solid waste, and wood and wood waste.102 There are many small landfill gas-to-energy facilities in cities around the state. Maryland's largest biomass-fueled electricity-generating plants account for about 70% of the state's total biomass generating capacity. They are two facilities that use municipal solid waste: a 57-megawatt facility in Baltimore and a 54-megawatt facility in Montgomery County in the suburbs of Washington, DC.103 The Baltimore facility also produces steam for a downtown piping system that supplies heat to more than 250 businesses.104
Maryland updated its renewable portfolio standard (RPS) in May 2019, when the Maryland legislature required that 50% of the state's electricity retail sales come from renewable sources by 2030.105,106,107 As part of the updated RPS, 14.5% of a supplier's electricity retail sales must come from solar power by 2030. The RPS also requires that the state's offshore wind generating capacity reach 400 megawatts in 2026 and increase to at least 1,200 megawatts in 2030.108,109 Maryland's legislature enacted a separate law in 2022 to further reduce the state's greenhouse gas emissions to 60% below the 2006 levels by 2031 and to reach a net-zero emissions level by 2045. Maryland met an already existing target to cut greenhouse gas emissions 25% below the 2006 baseline by 2020, exceeding it with a 30% reduction. The new law also boosts energy conservation measures for buildings and requires the state government to buy zero-emission vehicles.110,111
Endnotes
1 U.S. Energy Information Administration (EIA), U.S. Energy Atlas, All Energy Infrastructure and Resources, Maryland, accessed November 10, 2023.
2 U.S. Department of Transportation, Bureau of Transportation Statistics, Table 1-57, Tonnage of Top 50 U.S. Water Ports, Ranked by Total Tons, accessed November 9, 2023.
3 Maryland.gov, Maryland at a Glance, Waterways, Port of Baltimore, Terminals, Cargo, accessed November 9, 2023.
4 National Renewable Energy Laboratory, Geospatial Data Science Data and Tools, Maps, Biomass, Geothermal, Marine & Hydrokinetic, Solar, Wind, accessed November 9, 2023.
5 Maryland Department of Planning, State Data Center, Maryland Population Density by Census Tract, 2020.
6 U.S. Census Bureau, Data, Historical Population Density Data (1910-2020), updated April 26, 2021.
7 U.S. Department of Agriculture, Economic Research Service, Maryland, Three rural definitions based on Census Places, accessed November 9, 2023.
8 World Atlas, Maryland, Maryland Geography, accessed November 9, 2023.
9 Maryland State Archives, Maryland at a Glance, Weather, accessed November 20, 2023.
10 Current Results, Average Annual Snowfall in Maryland, accessed November 9, 2023.
11 U.S. EIA, State Energy Data System, Table P3, Total Primary Energy Production and Consumption Estimates in Trillion Btu, 2021.
12 U.S. EIA, State Energy Data System, Table C11, Total Energy Consumption Estimates by End-Use Sector, Ranked by State, 2021.
13 U.S. EIA, State Energy Data System, Table C14, Total Energy Consumption per Capita by End-Use Sector, Ranked by State, 2021.
14 U.S. EIA, State Energy Data System, Table C10, Total Energy Consumption Estimates, Real Gross Domestic Product (GDP), Energy Consumption Estimates per Real Dollar of GDP, Ranked by State, 2021.
15 U.S. Bureau of Economic Analysis, Interactive Data, Regional Data, GDP and Personal Income, Annual Gross Domestic Product (GDP) by State, SAGDP2 GDP in current dollars, Maryland, All statistics in table, 2022.
16 U.S. EIA, Crude Oil Proved Reserves, Reserves Changes, and Production, Proved Reserves as of 12/31, 2016-21.
17 U.S. EIA, Crude Oil Production, Annual-Thousand Barrels per day, 2017-22.
18 U.S. EIA, Number and Capacity of Petroleum Refineries, Total Number of Operable Refineries, 2017-22.
19 Colonial Pipeline, System Map and Frequently Asked Questions, Who is Colonial Pipeline?, accessed November 10, 2023.
20 U.S. EIA, Petroleum and Other Liquids, Company Level Imports, September 2022 to July 2023.
21 BWC Terminals, Baltimore, MD, accessed November 10, 2023.
22 U.S. EIA, State Energy Data System, Table C15, Petroleum Consumption, Total and per Capita, Ranked by State, 2021.
23 U.S. EIA, State Energy Data System, Table F16, Total Petroleum Consumption Estimates, 2021.
24 U.S. Environmental Protection Agency, Gasoline Standards, Reformulated Gasoline, accessed November 10, 2023.
25 American Petroleum Institute, U.S. Gasoline Requirements, updated January 2018.
26 U.S. EIA, State Energy Data System, Table F16, Total Petroleum Consumption Estimates, 2021.
27 U.S. Census Bureau, House Heating Fuel, Table B25040, 2022 ACS 1-Year Estimates Detailed Tables, Maryland.
28 U.S. EIA, Natural Gas Reserves Summary as of Dec. 31, Wet NG, 2016-21.
29 U.S. EIA, Natural Gas Gross Withdrawals and Production, Marketed Production, Annual, 2017-22.
30 U.S. EIA, U.S. Energy Atlas, All Energy Infrastructure and Resources, Maryland, accessed November 12, 2023.
31 U.S. EIA, Natural Gas Gross Withdrawals and Production, Marketed Production, Annual, 2017-22.
32 U.S. EIA, Structure map of the Marcellus Formation, accessed November 12, 2023.
33 Wiggins, Ovetta and Josh Hicks, "Maryland Senate gives final approval to fracking ban," The Washington Post (March 28, 2017).
34 U.S. EIA, U.S. Energy Atlas, All Energy Infrastructure and Resources, Maryland, accessed November 12, 2023.
35 U.S. EIA, International and Interstate Movements of Natural Gas by State, Maryland, Annual, 2017-22.
36 U.S. EIA, International and Interstate Movements of Natural Gas by State, Maryland, Annual, 2017-22.
37 BHE GT&S, Cove Point LNG, accessed November 12, 2023.
38 Federal Energy Regulatory Commission, United States LNG Import Terminals Existing (October 30, 2023).
39 BHE GT&S, Cove Point LNG, accessed November 12, 2023.
40 U.S. EIA, Maryland Natural Gas International Receipts, 1967-2022.
41 U.S. EIA, "U.S. natural gas production grew by 4% in 2022," Today in Energy (February 17, 2022).
42 U.S. EIA, "U.S. LNG imports reached 15-year lows first-half 2022, displaced by natural gas production," Today in Energy (September 27, 2022).
43 Dominion Energy, "First LNG Commissioning Cargo Departs From Dominion Energy Cove Point Terminal," Press Release (March 2, 2018).
44 Federal Energy Regulatory Commission, United States LNG Export Terminals Existing (November 9, 2023).
45 U.S. EIA, State Energy Data System, Table C16, Natural Gas Consumption, Total and per Capita, Ranked by State, 2021.
46 U.S. EIA, Natural Gas Consumption by End Use (million cubic feet), 2017-22.
47 U.S. EIA, Electricity Data Browser, Maryland, Net generation for all sectors (thousand megawatthours), annual, 2001-22.
48 U.S. EIA, Natural Gas Consumption by End Use (million cubic feet), 2017-22.
49 U.S. Census Bureau, House Heating Fuel, Table B25040, 2022 ACS 1-Year Estimates Detailed Tables, Maryland.
50 U.S. EIA, Annual Coal Report 2022 (October 3, 2023), Table 1, Coal Production and Number of Mines by State and Mine Type, 2022 and 2021.
51 U.S. EIA, Annual Coal Report 2022 (October 3, 2023), Table 15, Recoverable Coal Reserves at Producing Mines, Estimated Recoverable Reserves, and Demonstrated Reserve Base by Mining Method, 2022.
52 U.S. EIA, Annual Coal Report 2022 (October 3, 2023), Table 1, Coal Production and Number of Mines by State and Mine Type, 2022 and 2021.
53 U.S. EIA, U.S. Energy Atlas, All Energy Infrastructure and Resources, Maryland, accessed November 12, 2023.
54 U.S. EIA, Annual Coal Distribution Report 2022 (October 3, 2022), Domestic Distribution of U.S. coal by origin state, Maryland, Table OS-11, Domestic Coal Distribution, by Origin State, 2022.
55 U.S. EIA, Annual Coal Distribution Report 2022 (October 3, 2023), Domestic and Foreign Distribution of U.S. Coal by Origin State, 2022.
56 U.S. EIA, Annual Coal Distribution Report 2022 (October 3, 2023), Domestic distribution of U.S. coal by destination state, Maryland, Table DS-17, Domestic Coal Distribution, by Destination State, 2022.
57 U.S. EIA, Quarterly Coal Report October-December 2022 (April 2023), Table 13, U.S. Coal Exports by Customs District.
58 Maryland.gov, Maryland at a Glance, Waterways, Port of Baltimore, Terminals, Cargo, accessed November 12, 2023.
59 Maryland Department of Transportation, Maryland Port Administration, Port of Baltimore, 2019 Foreign Commerce Statistical Report, Top Commodities - Tons, p. 8, 2019 Bulk Cargo Summary - Tons, p. 10.
60 U.S. EIA, Quarterly Coal Report October-December 2022 (April 2023), Table 13, U.S. Coal Exports by Customs District; Table 14, Steam Coal Exports by Customs District; Table 15, Metallurgical Coal Exports by Customs District.
61 U.S. EIA, Quarterly Coal Report October-December 2022 (April 2023), Table 20, Coal imports by Customs District.
62 U.S. EIA, Electricity Data Browser, Maryland, Net generation for all sectors (thousand megawatthours), annual, 2001-22.
63 U.S. Nuclear Regulatory Commission, Maryland, updated March 9, 2021.
64 U.S. EIA, Electricity Data Browser, Maryland, Net generation for all sectors (thousand megawatthours), annual, 2001-22.
65 U.S. EIA, Electricity, Preliminary Monthly Electric Generator Inventory (based on Form EIA-860M as a supplement to Form EIA-860), Inventory of Operating Generators as of October 2023, Plant State: Maryland, Technology: Natural Gas Fired Combustion Turbine; Natural Gas Internal Combustion Engine; Natural Gas Fired Combined Cycle.
66 U.S. EIA, Electricity Data Browser, Maryland, Net generation for all sectors (thousand megawatthours), annual, 2001-22.
67 U.S. EIA, Electricity, Preliminary Monthly Electric Generator Inventory (based on Form EIA-860M as a supplement to Form EIA-860), Inventory of Operating Generators as of October 2023, Plant State: Maryland, Technology: Conventional Steam Coal.
68 Condon, Charles, "Western Maryland coal-burning power plant to retire in 2024, becoming state's last to announce closing," The Baltimore Sun (November 15, 2023).
69 U.S. EIA, Electricity Data Browser, Maryland, Net generation for all sectors (thousand megawatthours), annual, 2001-22.
70 U.S. EIA, Electricity, Preliminary Monthly Electric Generator Inventory (based on Form EIA-860M as a supplement to Form EIA-860), Inventory of Operating Generators as of October 2023, Plant State: Maryland, Technology: All.
71 U.S. EIA, State Energy Data System, Table C17, Electricity Retail Sales, Total and Residential, Total and per Capita, Ranked by State, 2021.
72 U.S. EIA, Maryland Electricity Profile 2022, Table 10, Supply and disposition of electricity, 1990 through 2022.
73 PJM, About PJM, Territory Served, accessed November 14, 2023.
74 U.S. EIA, Electricity Data Browser, Maryland, Retail sales of electricity (million kilowatthours), annual 2001-22.
75 U.S. Census Bureau, House Heating Fuel, Table B25040, 2022 ACS 1-Year Estimates Detailed Tables, Maryland.
76 U.S. EIA, Electricity Data Browser, Maryland, Retail sales of electricity (million kilowatthours), annual 2001-22.
77 Zero Emission Electric Vehicle Infrastructure Council, EV Station Data & Infrastructure, Maryland, accessed November 14, 2023.
78 Maryland EV, Incentives, accessed November 14, 2023.
79 U.S. EIA, Electricity Data Browser, Maryland, Net generation for all sectors (thousand megawatthours), annual, 2001-22.
80 U.S. EIA, Electricity Data Browser, Maryland, Net generation for all sectors (thousand megawatthours), annual, 2001-22.
81 U.S. EIA, Electric Power Monthly (June 2023), Table 6.2.B.
82 U.S. EIA, Electricity, Preliminary Monthly Electric Generator Inventory (based on Form EIA-860 M as a supplement to Form EIA-860), Inventory of Planned Generators as of October 2023, Plant State: Maryland, Technology: Solar Photovoltaic.
83 U.S. EIA, Electricity Data Browser, Maryland, Net generation for all sectors (thousand megawatthours), annual, 2001-22.
84 Exelon, Locations, Conowingo Hydroelectric Generating Station, accessed November 15, 2023.
85 "A Hydro Plant That Rivals Niagara Falls," Popular Science Monthly (May 1930), p. 49.
86 U.S. EIA, Maryland Electricity Profile 2022, Table 2A, Ten largest plants by capacity, 2022 and Table 2B, Ten largest plants by generation, 2022.
87 U.S. EIA, Electricity Data Browser, Maryland, Net generation for all sectors (thousand megawatthours), annual, 2001-22.
88 U.S. Department of Energy, Office of Renewable Energy and Energy Efficiency, WINDExchange, Wind Energy in Maryland, Maps & Data, accessed November 15, 2023.
89 U.S. EIA, Electricity, Preliminary Monthly Electric Generator Inventory (based on Form EIA-860 M as a supplement to Form EIA-860), Inventory of Operating Generators as of October 2023, Plant State: Maryland, Technology: Onshore Wind Turbine.
90 U.S. Department of Energy, Office of Renewable Energy and Energy Efficiency, WINDExchange, Wind Energy in Maryland, Maps & Data, Maryland Offshore 90-Meter Wind Map and Wind Resource Potential, accessed November 15, 2023.
91 US Wind, Maryland Offshore Wind Project, accessed November 20, 2023.
92 Offshore Wind Maryland, Offshore Wind Projects in Maryland, Maryland's Projects in Depth, accessed November 20, 2023.
93 U.S. Wind, Construction and Operations Plan: Maryland Offshore Wind Project, p. 16-18.
94 Winter, Allison, "Biden Banks on Md. Offshore Wind Projects to Help Curb Climate Change," Maryland Matters (April 22, 2021).
95 U.S. Wind, Momentum Wind, accessed November 20, 2023.
96 Offshore Wind Maryland, Offshore Wind Projects in Maryland, Maryland's Projects in Depth, accessed November 20, 2023.
97 Bureau of Ocean Energy Management, Maryland Offshore Wind, Project Overview, accessed November 20, 2023.
98 Orsted, About Skipjack Wind, accessed November 20, 2023.
99 Offshore Wind Maryland, Offshore Wind Projects in Maryland, Maryland's Projects in Depth, accessed November 20, 2023.
100 Fine, Ariana, "Skipjack Wind 2 Chosen as Second Offshore Wind Project in MD," North American Windpower (February 21, 2022).
101 U.S. EIA, Electricity, Preliminary Monthly Electric Generator Inventory (based on Form EIA-860 M as a supplement to Form EIA-860), Inventory of Planned Generators as of October 2023, Plant State: Maryland, Technology: Offshore Wind Turbine.
102 U.S. EIA, Electricity Data Browser, Maryland, Net generation for all sectors (thousand megawatthours), annual, 2001-22.
103 U.S. EIA, Electricity, Preliminary Monthly Electric Generator Inventory (based on Form EIA-860 M as a supplement to Form EIA-860), Inventory of Operating Generators as of October 2023, Plant State: Maryland, Technology: Landfill Gas, Municipal Solid Waste, Wood/Wood Waste Biomass, Other Waste Biomass.
104 Wheelabrator Technologies, Locations, Wheelabrator Baltimore, accessed November 16, 2023.
105 NC Clean Energy Technology Center, DSIRE, Maryland, Renewable Energy Portfolio Standard, updated November 8, 2023.
106 Dance, Scott, "Maryland bill mandating 50% renewable energy by 2030 to become law, but without Gov. Larry Hogan's signature," The Baltimore Sun (May 22, 2019).
107 Maryland Public Service Commission, Maryland Renewable Portfolio Standard (RPS), accessed November 16, 2023.
108 Maryland General Assembly, Clean Energy Jobs Act of 2019, accessed November 16, 2023.
109 Maryland Public Service Commission, Offshore Wind Fact Sheet, accessed November 16, 2023.
110 Maryland Nonprofits, Action to Care: Climate Solutions Now Act (August 2, 2022).
111 Maryland Department of the Environment, "Maryland Surpasses 2020 Greenhouse Gas Emissions Reduction Goal," Press Release (October 25, 2022).
Other Resources
Energy-Related Regions and Organizations
- Coal Region: Appalachian
- Petroleum Administration for Defense District (PADD): 1B
- Regional Transmission Organization (RTO) and Independent System Operator (ISO): PJM Interconnection (PJM)
- North American Electric Reliability Corporation (NERC) ERO Enterprise: Regional Entities: Reliability First Corporation (RFC)
Other Websites
- Maryland Energy Administration
- Maryland Public Service Commission
- Maryland Department of Housing and Community Development - Multifamily Energy Efficiency and Housing Affordability Program
- Maryland Department of Housing and Community Development - Weatherization Assistance Program
- Maryland Department of the Environment - Mining Program
- Maryland Department of Housing and Community Development, EmPOWER Maryland Limited Income Energy Efficiency Program
- Maryland Department of Human Resources, Office of Home Energy Programs
- Maryland Energy Administration - Business Incentives
- Maryland Energy Administration - Energy Finance
- Maryland Green Registry - Energy
- Fuel Fund of Maryland
- Maryland Department of Natural Resources, Power Plant Research Program
- Maryland Department of the Environment - Residential Heating Oil
- Maryland Energy Administration - Residential Incentives
- Maryland Clean Energy Center
- Maryland Environmental Service
- EIA Maryland Flickr Album
- Southern States Energy Board
- Alternative Fuels Data Center, Federal and State Laws and Incentives
- Benefits.Gov, Housing and Public Utilities
- NC Clean Energy Technology Center, Database of State Incentives for Renewables and Efficiency (DSIRE)
- National Association of Regulatory Utility Commissioners (NARUC)
- National Association of State Energy Officials (NASEO)
- National Conference of State Legislatures (NCSL), Research and Policy
- National Renewable Energy Laboratory (NREL), Geospatial Data Science Data and Tools
- U.S. Geological Survey (USGS), Publications
- U.S. Geological Survey, Maps
- Interstate Oil and Gas Compact Commission (IOGCC)
- U.S. Department of the Interior, Bureau of Ocean Energy Management
- U.S. Department of Health & Human Services, Office of Community Services, An Office of the Administration for Children & Families, Low Income Home Energy Assistance Program (LIHEAP)
- Lawrence Livermore National Laboratory, Energy Flow Charts
- National Renewable Energy Laboratory, State and Local Planning for Energy (SLOPE)
- EIA Status of U.S. Nuclear Outages
- The Regional Greenhouse Gas Initiative
- EIA Natural Gas Storage Dashboard
- EIA Energy Disruptions
- U.S. Department of Agriculture (USDA), Rural Development, Energy Programs