Kansas Quick Facts
- In 2023, Kansas accounted for about 1% of both U.S. proved crude oil reserves and U.S. total oil production. The state's three petroleum refineries provide 2% of U.S. refining capacity and combined can process about 408,000 barrels of crude oil per calendar day.
- Kansas is the eighth-largest ethanol-producing state, and its 12 ethanol plants have a combined production capacity of about 630 million gallons a year.
- In 2023, wind energy accounted for 46% of Kansas's electricity net generation, which was the third-highest share of wind power for any state after Iowa and South Dakota.
- Conway, Kansas, is a major hydrocarbon gas liquid products storage and pricing hub for propane and ethane.
- Kansas has 16 natural gas underground storage fields that can hold 283 billion cubic feet of natural gas, equal to about 3% of U.S. storage capacity.
Last Updated: July 18, 2024
Data
Last Update: July 18, 2024 | Next Update: August 15, 2024
| Prices | |||||
|---|---|---|---|---|---|
| Petroleum | Kansas | U.S. Average | Period | find more | |
| Domestic Crude Oil First Purchase | $ 80.94 /barrel | $ 83.16 /barrel | Apr-24 | ||
| Natural Gas | Kansas | U.S. Average | Period | find more | |
| City Gate | $ 4.62 /thousand cu ft | $ 3.43 /thousand cu ft | Apr-24 | find more | |
| Residential | $ 15.57 /thousand cu ft | $ 14.93 /thousand cu ft | Apr-24 | find more | |
| Coal | Kansas | U.S. Average | Period | find more | |
| Average Sales Price | -- | $ 54.46 /short ton | 2022 | ||
| Delivered to Electric Power Sector | $ 1.61 /million Btu | $ 2.54 /million Btu | Apr-24 | ||
| Electricity | Kansas | U.S. Average | Period | find more | |
| Residential | 14.38 cents/kWh | 16.88 cents/kWh | Apr-24 | find more | |
| Commercial | 11.05 cents/kWh | 12.66 cents/kWh | Apr-24 | find more | |
| Industrial | 7.85 cents/kWh | 7.82 cents/kWh | Apr-24 | find more | |
| Reserves | |||||
|---|---|---|---|---|---|
| Reserves | Kansas | Share of U.S. | Period | find more | |
| Crude Oil (as of Dec. 31) | 335 million barrels | 0.7% | 2022 | find more | |
| Expected Future Production of Dry Natural Gas (as of Dec. 31) | 3,151 billion cu ft | 0.5% | 2022 | find more | |
| Expected Future Production of Natural Gas Plant Liquids | 207 million barrels | 0.6% | 2022 | find more | |
| Recoverable Coal at Producing Mines | -- | -- | 2022 | find more | |
| Rotary Rigs & Wells | Kansas | Share of U.S. | Period | find more | |
| Natural Gas Producing Wells | 17,362 wells | 3.6% | 2020 | find more | |
| Capacity | Kansas | Share of U.S. | Period | ||
| Crude Oil Refinery Capacity (as of Jan. 1) | 404,600 barrels/calendar day | 2.2% | 2023 | ||
| Electric Power Industry Net Summer Capacity | 19,246 MW | 1.6% | Apr-24 | ||
| Supply & Distribution | |||||
|---|---|---|---|---|---|
| Production | Kansas | Share of U.S. | Period | find more | |
| Total Energy | 628 trillion Btu | 0.6% | 2022 | find more | |
| Crude Oil | 75 thousand barrels per day | 0.6% | Apr-24 | find more | |
| Natural Gas - Marketed | 147,846 million cu ft | 0.4% | 2022 | find more | |
| Coal | -- | -- | 2022 | find more | |
| Total Utility-Scale Net Electricity Generation | Kansas | Share of U.S. | Period | find more | |
| Total Net Electricity Generation | 3,740 thousand MWh | 1.2% | Apr-24 | ||
| Utility-Scale Net Electricity Generation (share of total) | Kansas | U.S. Average | Period | ||
| Petroleum-Fired | 0.1 % | 0.3 % | Apr-24 | find more | |
| Natural Gas-Fired | 11.5 % | 39.5 % | Apr-24 | find more | |
| Coal-Fired | 8.6 % | 12.0 % | Apr-24 | find more | |
| Nuclear | -0.1 % | 18.5 % | Apr-24 | find more | |
| Renewables | 79.8 % | 29.3 % | Apr-24 | ||
| Stocks | Kansas | Share of U.S. | Period | find more | |
| Motor Gasoline (Excludes Pipelines) | 252 thousand barrels | 2.2% | Apr-24 | ||
| Distillate Fuel Oil (Excludes Pipelines) | 2,351 thousand barrels | 2.6% | Apr-24 | find more | |
| Natural Gas in Underground Storage | 243,243 million cu ft | 3.5% | Apr-24 | find more | |
| Petroleum Stocks at Electric Power Producers | 237 thousand barrels | 1.1% | Apr-24 | find more | |
| Coal Stocks at Electric Power Producers | 5,701 thousand tons | 4.2% | Apr-24 | find more | |
| Fueling Stations | Kansas | Share of U.S. | Period | ||
| Motor Gasoline | 1,076 stations | 1.0% | 2021 | ||
| Propane | 35 stations | 1.5% | Jun-24 | ||
| Electric Vehicle Charging Locations | 450 stations | 0.7% | Jun-24 | ||
| E85 | 66 stations | 1.5% | Jun-24 | ||
| Biodiesel, Compressed Natural Gas, and Other Alternative Fuels | 33 stations | 1.1% | Jun-24 | ||
| Consumption & Expenditures | |||||
|---|---|---|---|---|---|
| Summary | Kansas | U.S. Rank | Period | ||
| Total Consumption | 1,001 trillion Btu | 31 | 2022 | find more | |
| Total Consumption per Capita | 341 million Btu | 17 | 2022 | find more | |
| Total Expenditures | $ 17,246 million | 33 | 2022 | find more | |
| Total Expenditures per Capita | $ 5,873 | 17 | 2022 | find more | |
| by End-Use Sector | Kansas | Share of U.S. | Period | ||
| Consumption | |||||
| » Residential | 189 trillion Btu | 1.0% | 2022 | find more | |
| » Commercial | 175 trillion Btu | 1.1% | 2022 | find more | |
| » Industrial | 370 trillion Btu | 1.2% | 2022 | find more | |
| » Transportation | 267 trillion Btu | 1.0% | 2022 | find more | |
| Expenditures | |||||
| » Residential | $ 3,181 million | 1.0% | 2022 | find more | |
| » Commercial | $ 2,572 million | 1.1% | 2022 | find more | |
| » Industrial | $ 3,229 million | 1.1% | 2022 | find more | |
| » Transportation | $ 8,264 million | 1.0% | 2022 | find more | |
| by Source | Kansas | Share of U.S. | Period | ||
| Consumption | |||||
| » Petroleum | 66 million barrels | 0.9% | 2022 | find more | |
| » Natural Gas | 309 billion cu ft | 1.0% | 2022 | find more | |
| » Coal | 13,139 thousand short tons | 2.5% | 2022 | find more | |
| Expenditures | |||||
| » Petroleum | $ 10,022 million | 1.0% | 2022 | find more | |
| » Natural Gas | $ 2,734 million | 1.0% | 2022 | find more | |
| » Coal | $ 429 million | 1.6% | 2022 | find more | |
| Consumption for Electricity Generation | Kansas | Share of U.S. | Period | find more | |
| Petroleum | 12 thousand barrels | 0.8% | Apr-24 | find more | |
| Natural Gas | 4,298 million cu ft | 0.5% | Apr-24 | find more | |
| Coal | 223 thousand tons | 1.1% | Apr-24 | find more | |
| Energy Source Used for Home Heating (share of households) | Kansas | U.S. Average | Period | ||
| Natural Gas | 63.3 % | 46.2 % | 2022 | ||
| Fuel Oil | 0.1 % | 3.9 % | 2022 | ||
| Electricity | 26.7 % | 41.3 % | 2022 | ||
| Propane | 7.7 % | 5.0 % | 2022 | ||
| Other/None | 2.2 % | 3.5 % | 2022 | ||
| Environment | |||||
|---|---|---|---|---|---|
| Renewable Energy Capacity | Kansas | Share of U.S. | Period | find more | |
| Total Renewable Energy Electricity Net Summer Capacity | 9,099 MW | 2.6% | Apr-24 | ||
| Ethanol Plant Nameplate Capacity | 630 million gal/year | 3.6% | 2023 | ||
| Renewable Energy Production | Kansas | Share of U.S. | Period | find more | |
| Utility-Scale Hydroelectric Net Electricity Generation | 1 thousand MWh | * | Apr-24 | ||
| Utility-Scale Solar, Wind, and Geothermal Net Electricity Generation | 2,995 thousand MWh | 4.0% | Apr-24 | ||
| Utility-Scale Biomass Net Electricity Generation | NM | NM | Apr-24 | ||
| Small-Scale Solar Photovoltaic Generation | 15 thousand MWh | 0.2% | Apr-24 | ||
| Fuel Ethanol Production | 13,641 thousand barrels | 3.7% | 2022 | ||
| Renewable Energy Consumption | Kansas | U.S. Rank | Period | find more | |
| Renewable Energy Consumption as a Share of State Total | 15.2 % | 10 | 2022 | ||
| Fuel Ethanol Consumption | 2,809 thousand barrels | 34 | 2022 | ||
| Total Emissions | Kansas | Share of U.S. | Period | find more | |
| Carbon Dioxide | 59.8 million metric tons | 1.2% | 2021 | ||
| Electric Power Industry Emissions | Kansas | Share of U.S. | Period | find more | |
| Carbon Dioxide | 23,881 thousand metric tons | 1.4% | 2022 | ||
| Sulfur Dioxide | 4 thousand metric tons | 0.4% | 2022 | ||
| Nitrogen Oxide | 18 thousand metric tons | 1.5% | 2022 | ||
Analysis
Last Updated: July 18, 2024
Overview
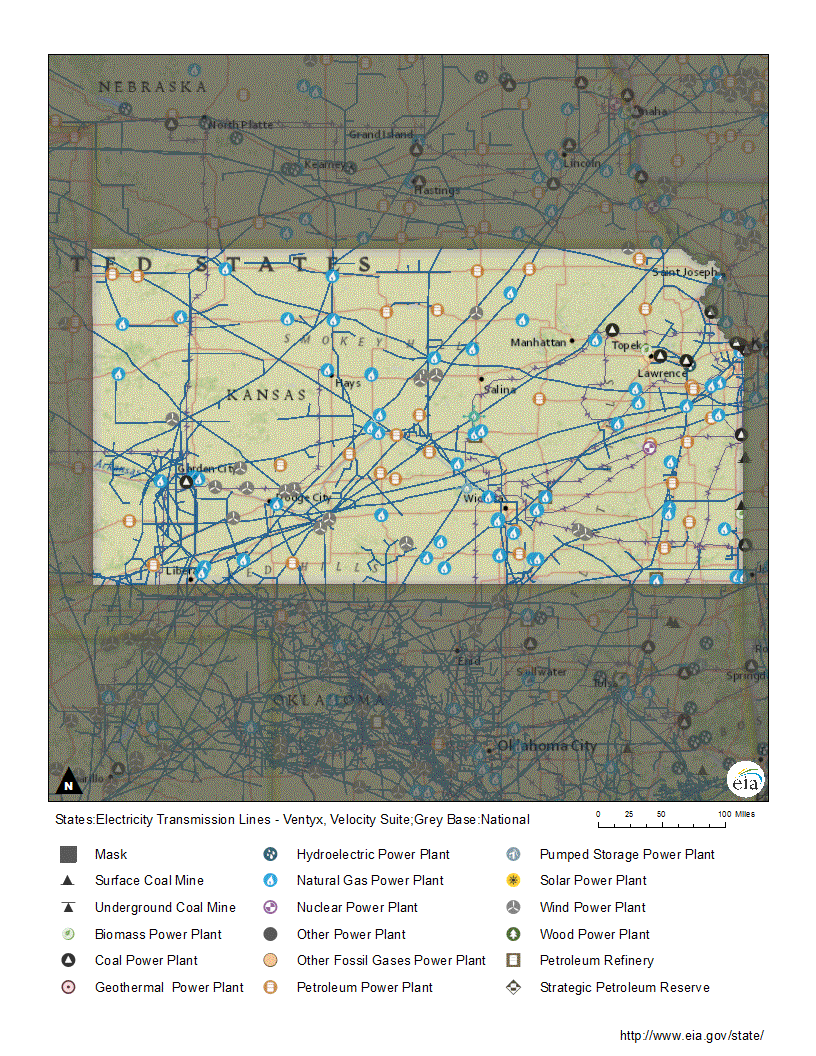
Kansas stretches more than 400 miles from east to west and the state has considerable crude oil, natural gas, and renewable energy resources. The state's broad plains rise gradually from about 600 feet above sea level at the Missouri River in the east to more than 4,000 feet on the state's border with Colorado on the state's western High Plains.1 Crude oil and natural gas fields are found throughout most of the state.2,3 Strong winds blow across the open prairie, creating significant wind energy resources in the state.4 Major river systems, including the Arkansas, Kansas, Republican, and Smoky Hill Rivers, flow from the High Plains eastward across Kansas, offering hydropower potential.5,6
With its Mid-Continent location far from the moderating effects of large bodies of water, Kansas has hot summers, frigid winters, and occasional severe weather, including tornados.7 Kansas averages more than 200 days of full or partial sunshine each year, and the western half of the state has significant solar energy resources that, along with fertile prairie soils, help make it a major agricultural state.8,9,10,11 Kansas ranks first in the nation in the total amount of cropland and is the number one producer of wheat and sorghum. The state also ranks third in the number of cattle and in beef production.12,13 The state's grain sorghum and corn crops are major feedstocks for ethanol production, and agricultural waste and animal manure provide substantial biomass resources.14,15
Kansas's industrial sector consumes the most energy in the state, accounting for nearly two-fifths of the state's total energy use. The sector includes manufacturing—particularly aviation and aerospace manufacturing—as well as agriculture and livestock processing, and the energy-intensive petroleum and natural gas industries.16,17 Transportation—the second-largest energy-consuming sector—uses about one-fourth. The residential and commercial sectors each account for less than one-fifth of state energy consumption.18
Petroleum
Kansas holds almost 1% of U.S. proved crude oil reserves and accounts for almost 1% of the nation's oil production.19,20 The 1892 discovery of crude oil near Neodesha, Kansas, is considered the first significant oil find west of the Mississippi River and was the first to indicate the vast oil potential of the Mid-Continent region.21 Today, oil fields are found throughout Kansas and are in all but a few counties in the north-central portion of the state.22 Since 2015, the state's crude oil production has steadily declined, except during 2022 when Kansas's annual oil production increased for the first time in eight years as the U.S. economy grew following the COVID-19 global pandemic, petroleum demand increased, and oil prices rose. The state's oil output declined in 2023 to the lowest in more than six decades.23,24,25
Kansas accounts for about 2% of U.S. crude oil refining capacity.
Kansas is also a crude oil-refining state. A network of pipelines delivers crude oil to the state's three refineries, which combined can process about 408,000 barrels of crude oil per calendar day. The state's refineries account for about 2% of the nation's refining capacity. The refineries produce a variety of petroleum products, including diesel fuel, motor gasoline, and jet fuel.26 The transportation sector is the largest consumer of petroleum in Kansas, accounting for about 7 out of 10 barrels used in the state. The industrial sector accounts for one-fourth of the state's petroleum consumption, while the residential and commercial sectors combined account for about 4%. The electric power sector uses a small amount of petroleum.27
Conway, Kansas, is a major hydrocarbon gas liquid products storage and pricing hub for propane and ethane.28,29 Kansas is among the 10 largest corn-producing states, and state consumption of propane rises in the autumn when farmers use it to dry the harvested crop.30,31 About 8 out of 100 Kansas household use petroleum, mainly propane, for home heating.32
Kansas is one of the top 10 ethanol-producing states.
Kansas is the 8th-largest ethanol-producing state.33 The state uses part of its corn crop as the feedstock to make fuel ethanol at 12 production plants, which have a combined capacity of 630 million gallons a year.34,35 Kansas produces almost five times more ethanol than the nearly 118 million gallons of ethanol it consumes annually, and the surplus ethanol is sent to blenders at fuel terminals in other states or exported to other countries.36,37 Conventional motor gasoline without ethanol can be sold statewide, except in the Kansas City metropolitan area, where gasoline must be blended with ethanol to reduce emissions that contribute to ground-level ozone. Almost all motor gasoline sold in the United States contains at least 10% ethanol.38,39 Kansas also has 66 public fueling stations that sell E-85 ethanol, which is a motor fuel blend that is 85% ethanol and 15% gasoline.40 Kansas ranks among the top 10 states with the largest biodiesel-producing capacity.41,42 The state's one biodiesel plant can produce 91 million gallons per year, nearly four times more than the state's annual biodiesel consumption of about 25 million gallons.43,44
Natural gas
In 2023, Kansas's marketed natural gas production was the lowest on record and made up around 0.3% of U.S. total output. The state's economically recoverable natural gas reserves account for about 0.5% of the U.S. total.45,46 The 12,000-square-mile Hugoton Gas Area, one of the largest natural gas fields in the United States, covers much of southwestern Kansas and parts of Oklahoma and Texas.47,48 Since 2009, Kansas's marketed natural gas production has declined every year, and its share of the U.S. total also decreased as natural gas production from shale resources grew in other states.49,50,51
Kansas has 16 underground natural gas storage fields that account for 3% of U.S. storage capacity.
Kansas typically consumes about twice as much natural gas as it produces.52,53 Natural gas enters the state via pipelines primarily from Oklahoma, Nebraska, and Colorado, and natural gas is shipped out of the state, mainly to Nebraska and Missouri.54 The Mid Continent Center pipeline system in south-central Kansas is a key natural gas interconnection, merging production from several states in the region and piping it east toward major natural gas-consuming markets.55,56 Some of the natural gas brought into Kansas is stored underground for later use. The state has 16 natural gas storage fields that together can hold up to 283 billion cubic feet of gas, which accounts for 3% of U.S. underground storage capacity.57,58
Kansas's industrial sector, which includes agriculture, manufacturing, and crude oil and natural gas production, accounted for nearly half of the state's natural gas deliveries in 2023. The residential sector accounted for about one-fifth of the state's natural gas use, and about 6 out of 10 Kansas households rely on natural gas as their primary energy source for home heating.59,60 The electric power sector, which used the largest amount of natural gas since 1983, accounted for about one-sixth of the state's natural gas deliveries in 2023. The commercial sector, which includes government buildings, businesses, hospitals, and schools, made up about one-seventh of the state's gas deliveries.61,62,63
Electricity
Wind has been the largest source of electricity generation in Kansas since 2019, when it surpassed coal's contribution. That trend continued in 2023, when wind accounted for 46% of the state's total net generation. Although wind power provided nearly half of in-state generation, only 2 wind farms are in the top 10 generating facilities by capacity in Kansas, and 3 wind farms are among the largest 10 by annual generation.64,65
Coal supplied 27% of Kansas's generation in 2023, with the share of coal-fired electricity generation down by more than half from 61% a decade earlier. Five of the state's 10 largest power plants by capacity and total yearly generation are fueled by coal.66,67 The state's one nuclear power plant, Wolf Creek Generating Station, accounted for 17% of electricity net generation in 2023. Natural gas-fired power plants contributed about 8% to the state's generation. The rest of Kansas's electricity generation came from solar energy, biomass, petroleum, and hydroelectric power.68,69
Kansas generates almost 50% more electricity than it consumes. The surplus power is sent to other states over the high-voltage transmission lines of the regional grid.70 About one in four state households rely on electricity as their primary energy source for heating.71 Both Kansas's per capita electricity demand and average electricity price in its residential sector are near the midpoint of the states.72,73
Renewable energy
In 2023, Kansas had the third-largest share of electricity generation from wind power of any state.
In 2023, renewable resources provided nearly half of Kansas's total state electricity net generation, and almost all of it was wind power.74 Kansas, with its wide plains, is among the states with the best wind power potential.75 The state ranked among the top five states in total wind-powered generation and had the third-largest share of electricity generated from wind, behind Iowa and South Dakota.76 At the end of 2023, the state had about 9,000 megawatts of installed wind generating capacity, the fourth-highest amount among the states.77 The state's largest wind facility, the 604-megawatt High Banks wind farm, came online in December 2023.78,79
Kansas also generates small amounts of renewable electricity from solar, biomass, and hydropower sources.80 Kansas is among the sunniest states in the country.81 The state has a small but growing amount of utility-scale (1 megawatt or larger capacity) solar generation, which was 10 times larger in 2023 than in 2018. However, the amount of small-scale, customer-sited (less than 1 megawatt capacity) solar generation, mostly from rooftop solar panels, was about 60% larger than the amount of solar power from the state's 14 utility-scale solar farms in 2023.82,83 Kansas's renewable generation from biomass comes from two facilities that use landfill gas and have a total generation capacity of 9 megawatts.84 Kansas is crossed by several major rivers that give it substantial hydropower resources, but most of the state's dams were built for flood control or to supply drinking water.85,86 The state has one utility-scale hydroelectric generating facility, located on the Kansas River with 11 turbines that together have 7 megawatts of generating capacity.87
In 2015, the Kansas legislature converted the state's mandatory renewable portfolio standard into a voluntary Renewable Energy Standard (RES) goal for the state's investor-owned and cooperative electric utilities. Under the RES goal, which has been met, electricity providers were to obtain 20% of their annual peak power demand from generating capacity fueled by eligible renewable resources by 2020 and for every year after that. Renewables that meet the goal include wind, solar, biomass, and hydropower.88,89 Customer-sited, small-scale generating facilities connected to the grid may be counted by utilities to meet the RES goal. In 2009, separate legislation established net metering for customers of investor-owned utilities to be credited for their surplus electricity put on the grid.90,91
Coal
The coal-fired Jeffrey Energy Center generating station is the largest power plant by capacity in Kansas.
Kansas has about 0.3% of U.S. estimated recoverable coal reserves, but the state no longer produces coal. Its last coal mine ceased operations in 2016.92,93,94 Coal had been mined in Kansas since the 1850s from shallow mines in the eastern part of the state. Significant amounts of coal were produced from both surface and underground mines in Kansas in the late 19th century and were used primarily to fuel railroad locomotives.95 To meet current coal demand, Kansas receives coal from other states and most of it is used in the electric power sector. Nearly all the coal used in the state's coal-fired power plants is shipped by rail from Wyoming. The coal-fired Jeffrey Energy Center generating station is the state's largest power plant by capacity (about 2,000 megawatts) and second-largest in annual generation (nearly 9 million megawatthours). Small amounts of coal are also transported by truck and rail from Missouri and Colorado for use at Kansas industrial plants.96,97
Endnotes
1 NETSTATE, Kansas, The Geography of Kansas, accessed June 11, 2024.
2 Kansas Geological Survey, KGS Special Map 6, Oil and Gas Fields of Kansas (2019).
3 U.S. Energy Information Administration (EIA), U.S. Energy Atlas, All Energy Infrastructure and Resources, Kansas, accessed June 11, 2024.
4 U.S. Department of Energy, Energy Efficiency and Renewable Energy, WINDExchange, Wind Energy in Kansas, Maps & Data, accessed June 11, 2024.
5 Hart, Megan, "Report Shows High Hydropower Potential, Some Kansans Skeptical," The Topeka Capital-Journal (May 17, 2014).
6 Maps of the World, Kansas River Map, accessed June 11, 2024.
7 Knapp, Mary, The Climate of Kansas, The Community Collaborative Rain, Hail & Snow Network, State Climate Series, accessed June 11, 2024.
8 Current Results, Days of Sunshine Per Year in Kansas, accessed June 11, 2024.
9 National Renewable Energy Laboratory, Solar Resource Data, Tools, and Map, U.S. Annual Solar GHI, Kansas, February 22, 2018.
10 National Park Service, Tallgrass Prairie, A Complex Prairie Ecosystem, accessed June 11, 2024.
11 Kansas Department of Agriculture, Kansas Agriculture, accessed June 11, 2024.
12 Kansas Department of Commerce, Agriculture, accessed June 11, 2024.
13 U.S. Department of Agriculture, Kansas Rank in U.S. Agriculture, updated May 1, 2024.
14 U.S. EIA, U.S. Fuel Ethanol Plant Production Capacity (August 7, 2023), Detailed annual production capacity by plant is available in XLSX.
15 National Renewable Energy Laboratory, Biomass Resource Data, Tools, and Maps, U.S. Biomass Resource Maps, Kansas, accessed June 11, 2024.
16 U.S. EIA, State Energy Data System, Table C1, Energy Consumption Overview: Estimates by Energy Source and End-Use Sector, 2022.
17 Kansas Department of Commerce, Kansas Industry, accessed June 11, 2024.
18 U.S. EIA, State Energy Data System, Table C1, Energy Consumption Overview: Estimates by Energy Source and End-Use Sector, 2022.
19 U.S. EIA, U.S. Crude Oil and Natural Gas Reserves, Year-end 2022 (April 29, 2024), Table 6.
20 U.S. EIA, Crude Oil Production, Annual-Thousand Barrels, 2018-23.
21 American Oil & Gas Historical Society, Oil Discovery in Neodesha, Kansas, accessed June 12, 2024.
22 Kansas Geological Survey, KGS Special Map 6, Oil and Gas Fields of Kansas (2019).
23 U.S. EIA, Kansas Field Production of Crude Oil, Annual, 1981-2023.
24 U.S. EIA, "COVID-19 mitigation efforts result in the lowest U.S. petroleum consumption in decades," Today in Energy (December 20, 2020).
25 U.S. EIA, State Energy Production Estimates 1960 Through 2022, Table PT1, Primary Energy Production Estimates in Physical Units, Kansas, 1960-2022.
26 U.S. EIA, Refinery Capacity Report 2024 (June 14, 2024), Table 3, Capacity of Operable Petroleum Refineries by State as of January 1, 2024.
27 U.S. EIA, State Energy Data System, Table F16, Total Petroleum Consumption Estimates, 2022.
28 Williams, Salt of the earth: NGL storage in Conway supports natural gas reliability, accessed June 11, 2024.
29 U.S. Department of Energy, Ethane Storage and Distribution Hub in the United States (November 2018), p. 5, 42-43.
30 U.S. Department of Agriculture, Kansas Rank in U.S. Agriculture, updated May 1, 2024.
31 U.S. EIA, "Propane Use for Crop Drying Depends on Weather and Corn Markets as well as Crop Size," Today in Energy (October 2, 2014).
32 U.S. Census Bureau, House Heating Fuel, Table B25040, 2022 ACS 1-Year Estimates Detailed Tables, Kansas.
33 U.S. EIA, State Energy Data System, Table P4B, Primary Energy Production Estimates, Biofuels, in Thousand Barrels, Ranked by State, 2022.
34 U.S. EIA, U.S. Fuel Ethanol Plant Production Capacity (August 7, 2023), Detailed nameplate capacity of fuel ethanol plants by Petroleum Administration for Defense District (PAD District) are available in XLSX.
35 U.S. EIA, "Most U.S. fuel ethanol production capacity at the start of 2022 was in the Midwest," Today in Energy (August 22, 2022).
36 U.S. EIA, State Energy Data System, Table P4B, Primary Energy Production Estimates, Biofuels, in Thousand Barrels, Ranked by State, 2022.
37 U.S. EIA, State Energy Data System, Table C2, Energy Consumption Estimates for Selected Energy Sources in Physical Units, 2022.
38 American Petroleum Institute, U.S. Gasoline Requirements, (January 2018).
39 U.S. EIA, "Almost all U.S. gasoline is blended with 10% ethanol," Today in Energy (May 4, 2016).
40 U.S. Department of Energy, Alternative Fuels Data Center, Kansas, accessed June 12, 2024.
41 U.S. EIA, "Most U.S. fuel ethanol production capacity at the start of 2022 was in the Midwest," Today in Energy (August 22, 2022).
42 U.S. EIA, State Energy Data System, Table P4B, Primary Energy Production Estimates, Biofuels, in Thousand Barrels, Ranked by State, 2022.
43 U.S. EIA, U.S. Biodiesel Plant Production Capacity (August 7, 2023), Detailed annual production capacity by plant is available in XLSX format.
44 U.S. EIA, State Energy Data System, Table C2, Energy Consumption Estimates for Selected Energy Sources in Physical Units, 2022.
45 U.S. EIA, U.S. Crude Oil and Natural Gas Reserves, Year-end 2022 (April 29, 2024), Table 8.
46 U.S. EIA, Natural Gas Gross Withdrawals and Production, Marketed Production, Annual-Million Cubic Feet, 2018-23.
47 Kansas Geological Survey, The Hugoton Project, Background, accessed June 13, 2024.
48 U.S. EIA, Top 100 U.S. Oil and Gas Fields (March 2015), Table 2.
49 U.S. EIA, Kansas Natural Gas Marketed Production (Million Cubic Feet), 1967-2023.
50 U.S. EIA, Natural Gas Gross Withdrawals and Production, Gross Withdrawals, Marketed Production, Annual-Cubic Feet, 2018-23.
51 U.S. EIA, "U.S. natural gas production grew by 4% in 2023, similar to 2022," Today in Energy (March 27, 2024).
52 U.S. EIA, Natural Gas Consumption by End Use, Kansas, Annual, 2018-23.
53 U.S. EIA, Natural Gas Annual Supply and Disposition by State, Kansas, Annual, 2018-23.
54 U.S. EIA, International and Interstate Movements of Natural Gas by State, Kansas, Annual, 2017-22.
55 ONEOK, Investor Update (November 2019), Mid-Continent Region, p. 45.
56 ONEOK, Mid Continent Market Center, L.L.C., accessed June 13, 2024.
57 U.S. EIA, Underground Natural Gas Storage Capacity, Total Number of Existing Fields, Annual, 2017-22.
58 U.S. EIA, Underground Natural Gas Storage Capacity, Total Storage Capacity, Annual, 2017-22.
59 U.S. Census Bureau, House Heating Fuel, Table B25040, 2022 ACS 1-Year Estimates Detailed Tables, Kansas.
60 U.S. EIA, Natural Gas Consumption by End Use, Kansas, Annual, 2018-23.
61 U.S. EIA, Energy Explained, How the United States uses energy, updated June 13, 2022.
62 U.S. EIA, Natural Gas Consumption by End Use, Kansas, Annual, 2018-23.
63 U.S. EIA, State Energy Data System: 1960-2022, Consumption, Full reports & data files, All consumption estimates, in physical units, CSV file, Kansas, NGEIP, 1960-2022.
64 U.S. EIA, Electricity Data Browser, Net generation from all sectors (thousand megawatthours), Kansas, Annual 2001-23.
65 U.S. EIA, State Electricity Profiles, Kansas Electricity Profile 2022, Table 2A, Ten largest plants by capacity, 2022, and Table 2B, Ten largest plants by generation, 2022.
66 U.S. EIA, Electricity Data Browser, Net generation from all sectors (thousand megawatthours), Kansas, Annual 2001-23.
67 U.S. EIA, State Electricity Profiles, Kansas Electricity Profile 2022, Table 2A, Ten largest plants by capacity, 2022, and Table 2B, Ten largest plants by generation, 2022.
68 U.S. EIA, Electricity Data Browser, Net generation from all sectors (thousand megawatthours), Kansas, Annual 2001-23.
69 U.S. EIA, U.S. Nuclear Generation and Generating Capacity, Capacity and Generation by State and Reactor, 2024P.
70 U.S. EIA, State Electricity Profiles, Kansas Electricity Profile 2022, Table 10, Supply and disposition of electricity.
71 U.S. Census Bureau, House Heating Fuel, Table B25040, 2022 ACS 1-Year Estimates Detailed Tables, Kansas.
72 U.S. EIA, Table C17, Electricity Sales to Ultimate Customers, Total and Residential, Total and per Capita, Ranked by State, 2022.
73 U.S. EIA, Electric Power Monthly (February 2023), Table 5.6.B.
74 U.S. EIA, Electricity Data Browser, Net generation from all sectors (thousand megawatthours), Kansas, Annual, 2001-23.
75 U.S. Department of Energy, Energy Efficiency and Renewable Energy, WINDExchange, Wind Energy in Kansas, Maps & Data, accessed June 14, 2024.
76 U.S. EIA, Electric Power Monthly (February 2024), Tables 1.3.B, 1.14.B, 1.17.B.
77 U.S. EIA, Electric Power Monthly (February 2024), Table 6.2.B.
78 U.S. EIA, Preliminary Monthly Electric Generator Inventory (based on Form EIA-860M as a supplement to Form EIA-860), Inventory of Operating Generators as of December 2023, Plant State: Kansas, Technology: Onshore Wind Turbine.
79 NextEra Energy, High Banks Wind Project, accessed June 14, 2024.
80 U.S. EIA, Electricity Data Browser, Net generation from all sectors (thousand megawatthours), Kansas, Annual 2001-23.
81 U.S. National Renewable Energy Laboratory, Global Horizontal Solar Irradiance, Kansas, (February 22, 2018).
82 U.S. EIA, Electricity Data Browser, Net generation from all sectors (thousand megawatthours), Kansas, Annual, 2001-23.
83 U.S. EIA, Preliminary Monthly Electric Generator Inventory (based on Form EIA-860M as a supplement to Form EIA-860), Inventory of Operating Generators as of May 2024 Plant State: Kansas, Technology: Solar Photovoltaic.
84 U.S. EIA, Preliminary Monthly Electric Generator Inventory (based on Form EIA-860M as a supplement to Form EIA-860), Inventory of Operating Generators as of May 2024 Plant State: Kansas, Technology: Landfill Gas.
85 University of Kansas, Kansas Geological Survey, Kansas Lakes and Rivers, accessed June 14, 2024.
86 American Rivers, Kansas River, accessed June 14, 2024.
87 Bowersock Hydropower, About Bowersock, accessed June 14, 2024.
88 NC Clean Energy Technology Center, DSIRE, Renewable Energy Goal, Kansas, Overview, updated December 6, 2023.
89 Kansas Corporation Commission, Kansas Renewable Energy Standard, accessed June 14, 2024.
90 NC Clean Energy Technology Center, DSIRE, Net Metering, Kansas, Program Overview, updated February 20, 2023.
91 Kansas Corporation Commission, Net Metering in Kansas, accessed June 14, 2024.
92 U.S. EIA, Annual Coal Report 2022 (October 3, 2023), Table 15, Recoverable Coal Reserves at Producing Mines, Estimated Recoverable Reserves, and Demonstrated Reserve Base by Mining Method, 2022.
93 University of Kansas, Kansas Geological Survey, Coal mining, accessed June 14, 2024.
94 U.S. EIA, Annual Coal Report 2022 (October 3, 2023), Table 6, Coal Production and Number of Mines by States and Coal Rank, 2022.
95 University of Kansas, Kansas Geological Survey, Coal mining, accessed June 14, 2024.
96 U.S. EIA, Annual Coal Distribution Report 2022 (October 3, 2023), Domestic distribution of U.S. coal by destination State, consumer, destination and method of transportation, Kansas, Table DS-14, Domestic Coal Distribution, by Destination State, 2022.
97 U.S. EIA, State Electricity Profiles, Kansas Electricity Profile 2022, Table 2A, Ten largest plants by capacity, 2022, and Table 2B, Ten largest plants by generation, 2022.
Other Resources
Energy-Related Regions and Organizations
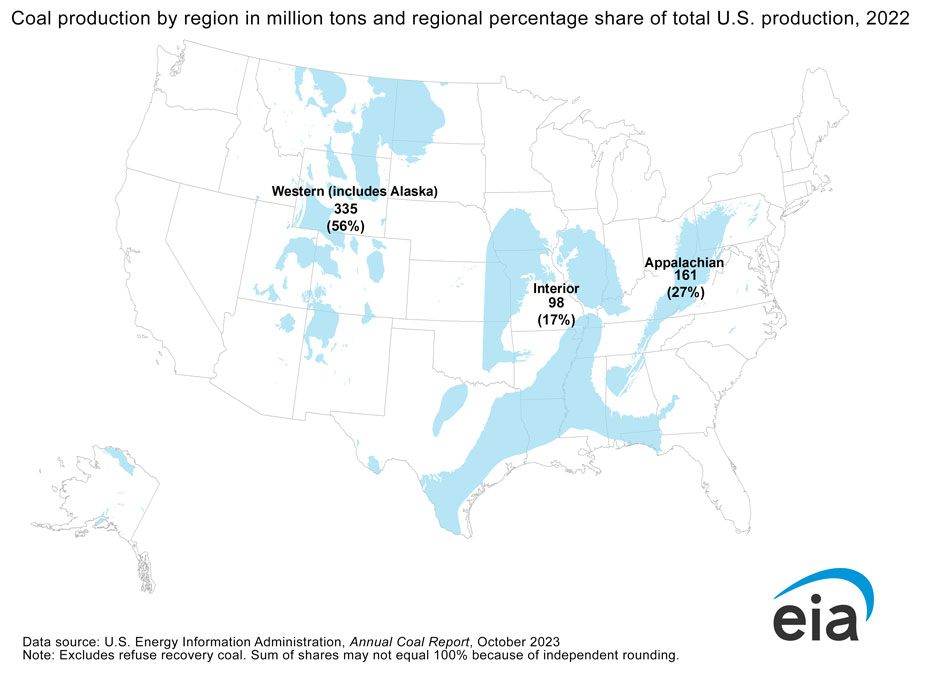
- Coal Region: Interior
- Petroleum Administration for Defense District (PADD): 2
- North American Electric Reliability Corporation (NERC) ERO Enterprise: Regional Entities: Midwest Reliability Organization (MRO), Southwest Power Pool, Inc (SPP)
Other Websites
- Kansas Department of Commerce, Energy & Natural Resources
- Kansas Corporation Commission
- Kansas Corporation Commission - Kansas Energy Office
- Kansas Corporation Commission - Oil and Gas
- Kansas Housing, Weatherization Assistance
- Kansas Energy Program
- Kansas Electric Cooperatives, Inc.
- Kansas Citizens' Utility Ratepayer Board
- University of Kansas, Earth, Energy & Environment Center
- Kansas Geological Survey, Energy
- EIA Kansas Flickr Album
- Alternative Fuels Data Center, Federal and State Laws and Incentives
- U.S. Department of Health & Human Services, Office of Community Services, An Office of the Administration for Children & Families, Low Income Home Energy Assistance Program (LIHEAP)
- Benefits.Gov, Housing and Public Utilities
- NC Clean Energy Technology Center, Database of State Incentives for Renewables and Efficiency (DSIRE)
- National Association of Regulatory Utility Commissioners (NARUC)
- National Association of State Energy Officials (NASEO)
- National Conference of State Legislatures (NCSL), Research and Policy
- National Renewable Energy Laboratory (NREL), Geospatial Data Science Data and Tools
- U.S. Geological Survey (USGS), Publications
- Interstate Oil and Gas Compact Commission (IOGCC)
- Western Area Power Administration (WAPA)
- Southwestern Power Administration
- U.S. Geological Survey, Maps
- Lawrence Livermore National Laboratory, Energy Flow Charts
- National Renewable Energy Laboratory, State and Local Planning for Energy (SLOPE)
- EIA Status of U.S. Nuclear Outages
- EIA Natural Gas Storage Dashboard
- EIA Energy Disruptions
- U.S. Department of Agriculture (USDA), Rural Development, Energy Programs