Arkansas Quick Facts
- Arkansas accounts for about 1% of U.S. marketed natural gas production and proved natural gas reserves.
- There are two biodiesel manufacturing plants in Arkansas with a combined production capacity of 75 million gallons per year, about 4% of the U.S. total.
- In 2023, natural gas was the leading fuel used to generate electricity in Arkansas and accounted for 39% of the state’s total net generation.
- Arkansas ranks among the 10 states with the lowest average electricity retail prices, and slightly more than half the state's households rely on electricity as their primary source for home heating.
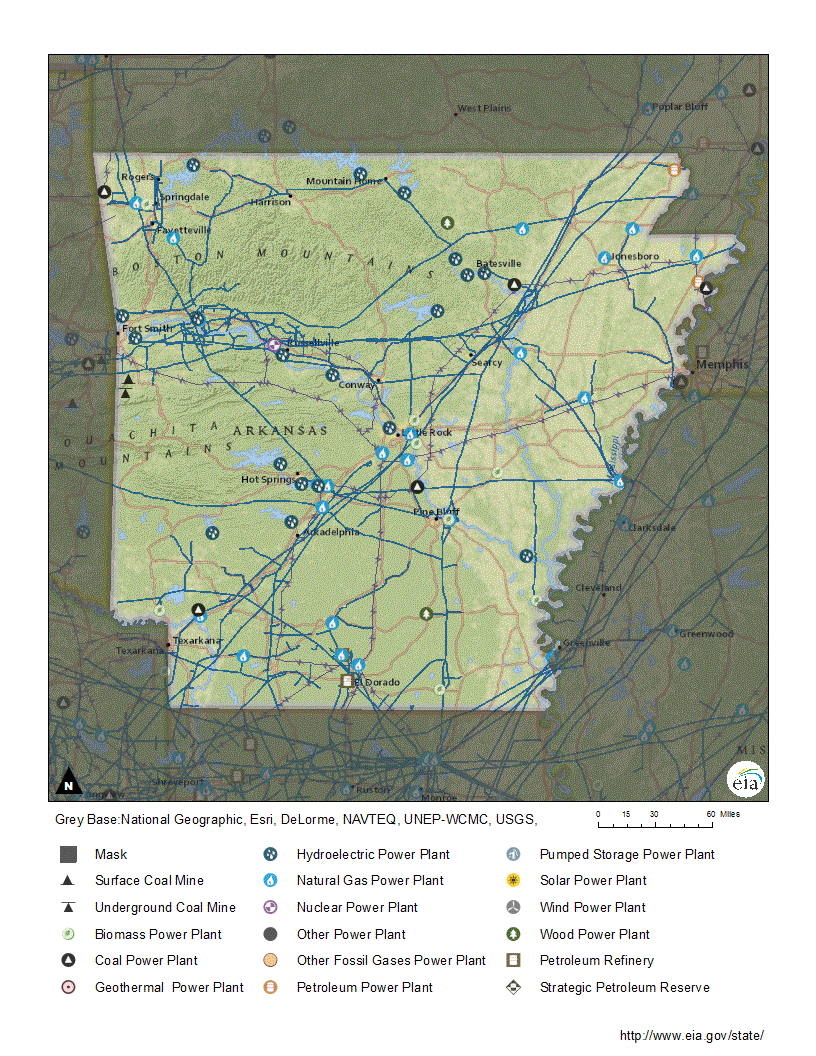
- Arkansas' only nuclear power plant (located on Lake Dardanelle about 60 miles northwest of Little Rock) generated 24% of total in-state electricity in 2023 and is the second-largest power plant by generating capacity in the state.
Last Updated: July 18, 2024
Data
Last Update: July 18, 2024 | Next Update: August 15, 2024
| Prices | |||||
|---|---|---|---|---|---|
| Petroleum | Arkansas | U.S. Average | Period | find more | |
| Domestic Crude Oil First Purchase | $ 78.44 /barrel | $ 83.16 /barrel | Apr-24 | ||
| Natural Gas | Arkansas | U.S. Average | Period | find more | |
| City Gate | $ 5.43 /thousand cu ft | $ 3.43 /thousand cu ft | Apr-24 | find more | |
| Residential | $ 15.30 /thousand cu ft | $ 14.93 /thousand cu ft | Apr-24 | find more | |
| Coal | Arkansas | U.S. Average | Period | find more | |
| Average Sales Price | -- | $ 54.46 /short ton | 2022 | ||
| Delivered to Electric Power Sector | W | $ 2.54 /million Btu | Apr-24 | ||
| Electricity | Arkansas | U.S. Average | Period | find more | |
| Residential | 12.60 cents/kWh | 16.88 cents/kWh | Apr-24 | find more | |
| Commercial | 10.20 cents/kWh | 12.66 cents/kWh | Apr-24 | find more | |
| Industrial | 5.86 cents/kWh | 7.82 cents/kWh | Apr-24 | find more | |
| Reserves | |||||
|---|---|---|---|---|---|
| Reserves | Arkansas | Share of U.S. | Period | find more | |
| Crude Oil (as of Dec. 31) | 39 million barrels | 0.1% | 2022 | find more | |
| Expected Future Production of Dry Natural Gas (as of Dec. 31) | 6,455 billion cu ft | 0.9% | 2022 | find more | |
| Expected Future Production of Natural Gas Plant Liquids | 3 million barrels | * | 2022 | find more | |
| Recoverable Coal at Producing Mines | -- | -- | 2022 | find more | |
| Rotary Rigs & Wells | Arkansas | Share of U.S. | Period | find more | |
| Natural Gas Producing Wells | 9,043 wells | 1.9% | 2020 | find more | |
| Capacity | Arkansas | Share of U.S. | Period | ||
| Crude Oil Refinery Capacity (as of Jan. 1) | 90,500 barrels/calendar day | 0.5% | 2023 | ||
| Electric Power Industry Net Summer Capacity | 15,065 MW | 1.3% | Apr-24 | ||
| Supply & Distribution | |||||
|---|---|---|---|---|---|
| Production | Arkansas | Share of U.S. | Period | find more | |
| Total Energy | 690 trillion Btu | 0.7% | 2022 | find more | |
| Crude Oil | 11 thousand barrels per day | 0.1% | Apr-24 | find more | |
| Natural Gas - Marketed | 416,196 million cu ft | 1.1% | 2022 | find more | |
| Coal | -- | -- | 2022 | find more | |
| Total Utility-Scale Net Electricity Generation | Arkansas | Share of U.S. | Period | find more | |
| Total Net Electricity Generation | 3,707 thousand MWh | 1.2% | Apr-24 | ||
| Utility-Scale Net Electricity Generation (share of total) | Arkansas | U.S. Average | Period | ||
| Petroleum-Fired | NM | 0.3 % | Apr-24 | find more | |
| Natural Gas-Fired | 40.3 % | 39.5 % | Apr-24 | find more | |
| Coal-Fired | 11.6 % | 12.0 % | Apr-24 | find more | |
| Nuclear | 33.8 % | 18.5 % | Apr-24 | find more | |
| Renewables | 13.9 % | 29.3 % | Apr-24 | ||
| Stocks | Arkansas | Share of U.S. | Period | find more | |
| Motor Gasoline (Excludes Pipelines) | 73 thousand barrels | 0.6% | Apr-24 | ||
| Distillate Fuel Oil (Excludes Pipelines) | 749 thousand barrels | 0.8% | Apr-24 | find more | |
| Natural Gas in Underground Storage | 14,663 million cu ft | 0.2% | Apr-24 | find more | |
| Petroleum Stocks at Electric Power Producers | 156 thousand barrels | 0.7% | Apr-24 | find more | |
| Coal Stocks at Electric Power Producers | 4,906 thousand tons | 3.6% | Apr-24 | find more | |
| Fueling Stations | Arkansas | Share of U.S. | Period | ||
| Motor Gasoline | 1,467 stations | 1.3% | 2021 | ||
| Propane | 27 stations | 1.1% | Jun-24 | ||
| Electric Vehicle Charging Locations | 338 stations | 0.5% | Jun-24 | ||
| E85 | 74 stations | 1.7% | Jun-24 | ||
| Biodiesel, Compressed Natural Gas, and Other Alternative Fuels | 45 stations | 1.6% | Jun-24 | ||
| Consumption & Expenditures | |||||
|---|---|---|---|---|---|
| Summary | Arkansas | U.S. Rank | Period | ||
| Total Consumption | 1,053 trillion Btu | 30 | 2022 | find more | |
| Total Consumption per Capita | 207 million Btu | 40 | 2022 | find more | |
| Total Expenditures | $ 17,392 million | 32 | 2022 | find more | |
| Total Expenditures per Capita | $ 4,475 | 42 | 2022 | find more | |
| by End-Use Sector | Arkansas | Share of U.S. | Period | ||
| Consumption | |||||
| » Residential | 218 trillion Btu | 1.1% | 2022 | find more | |
| » Commercial | 173 trillion Btu | 1.0% | 2022 | find more | |
| » Industrial | 379 trillion Btu | 1.2% | 2022 | find more | |
| » Transportation | 283 trillion Btu | 1.0% | 2022 | find more | |
| Expenditures | |||||
| » Residential | $ 2,999 million | 0.9% | 2022 | find more | |
| » Commercial | $ 2,132 million | 0.9% | 2022 | find more | |
| » Industrial | $ 3,592 million | 1.3% | 2022 | find more | |
| » Transportation | $ 8,669 million | 1.0% | 2022 | find more | |
| by Source | Arkansas | Share of U.S. | Period | ||
| Consumption | |||||
| » Petroleum | 64 million barrels | 0.9% | 2022 | find more | |
| » Natural Gas | 389 billion cu ft | 1.2% | 2022 | find more | |
| » Coal | 12,067 thousand short tons | 2.3% | 2022 | find more | |
| Expenditures | |||||
| » Petroleum | $ 10,147 million | 1.0% | 2022 | find more | |
| » Natural Gas | $ 3,614 million | 1.3% | 2022 | find more | |
| » Coal | $ 501 million | 1.9% | 2022 | find more | |
| Consumption for Electricity Generation | Arkansas | Share of U.S. | Period | find more | |
| Petroleum | NM | NM | Apr-24 | find more | |
| Natural Gas | 11,025 million cu ft | 1.2% | Apr-24 | find more | |
| Coal | 243 thousand tons | 1.1% | Apr-24 | find more | |
| Energy Source Used for Home Heating (share of households) | Arkansas | U.S. Average | Period | ||
| Natural Gas | 36.1 % | 46.2 % | 2022 | ||
| Fuel Oil | 0.1 % | 3.9 % | 2022 | ||
| Electricity | 54.7 % | 41.3 % | 2022 | ||
| Propane | 5.7 % | 5.0 % | 2022 | ||
| Other/None | 3.4 % | 3.5 % | 2022 | ||
| Environment | |||||
|---|---|---|---|---|---|
| Renewable Energy Capacity | Arkansas | Share of U.S. | Period | find more | |
| Total Renewable Energy Electricity Net Summer Capacity | 2,313 MW | 0.7% | Apr-24 | ||
| Ethanol Plant Nameplate Capacity | -- | -- | 2023 | ||
| Renewable Energy Production | Arkansas | Share of U.S. | Period | find more | |
| Utility-Scale Hydroelectric Net Electricity Generation | 291 thousand MWh | 1.5% | Apr-24 | ||
| Utility-Scale Solar, Wind, and Geothermal Net Electricity Generation | 200 thousand MWh | 0.3% | Apr-24 | ||
| Utility-Scale Biomass Net Electricity Generation | 70 thousand MWh | 1.9% | Apr-24 | ||
| Small-Scale Solar Photovoltaic Generation | 45 thousand MWh | 0.6% | Apr-24 | ||
| Fuel Ethanol Production | 0 thousand barrels | 0.0% | 2022 | ||
| Renewable Energy Consumption | Arkansas | U.S. Rank | Period | find more | |
| Renewable Energy Consumption as a Share of State Total | 8.4 % | 23 | 2022 | ||
| Fuel Ethanol Consumption | 3,708 thousand barrels | 31 | 2022 | ||
| Total Emissions | Arkansas | Share of U.S. | Period | find more | |
| Carbon Dioxide | 62.0 million metric tons | 1.3% | 2021 | ||
| Electric Power Industry Emissions | Arkansas | Share of U.S. | Period | find more | |
| Carbon Dioxide | 31,303 thousand metric tons | 1.9% | 2022 | ||
| Sulfur Dioxide | 37 thousand metric tons | 3.4% | 2022 | ||
| Nitrogen Oxide | 20 thousand metric tons | 1.6% | 2022 | ||
Analysis
Last Updated: July 18, 2024
Overview
Arkansas has a diverse geography, with mountains, lakes, forests, and river valleys. The state is rich in natural resources, with abundant natural gas, coal, oil, and timber. Arkansas is home to the only active diamond mine in the United States, the Crater of the Diamonds State Park, where visitors can search for rare gems.1,2 This is represented by the large diamond in the center of the Arkansas state flag.3 The Mississippi River flows along the state's eastern border, the northern edge of the Gulf Coastal Plain occupies southern Arkansas, and rugged highlands cover the state's north and west.4 The fertile Arkansas River Valley separates the Ouachita Mountains from the Ozark Plateau in western Arkansas. Most of the state's natural gas production is from the Arkoma Basin, which underlies the Arkansas River Valley. Coal resources are found in the valley near the state's western border, and coal resources also cover most of the eastern half of the state.5,6,7,8 To the south, the lowlands of the Gulf Coastal Plain contain the state's crude oil-producing area.9,10
Arkansas has considerable hydropower from rivers that flow generally east and south from the state's highland regions toward the Mississippi River.11 The Mississippi River Valley and the upper reaches of its delta occupy the eastern third of Arkansas.12 That area, part of the Mississippi River Alluvial Plain, has rich soils that, along with the state's hot, humid summers and mild, slightly drier winters, provide excellent conditions for agriculture.13,14 Agricultural wastes and the forests that cover almost three-fifths of the state supply Arkansas with significant biomass resources.15,16,17
Arkansas uses about 50% more energy than the state produces.
Arkansas consumes about 50% more energy than it produces, and its per capita energy consumption usually ranks among the top one-third of the states.18,19 The industrial sector, which includes agriculture, consumes the most energy of any end-use sector in Arkansas, accounting for more than one-third of the state's total energy use.20 Poultry, soybeans, and rice are the state's top three agricultural products in terms of cash farm receipts.21,22 Several energy-intensive manufacturing industries also are major contributors to Arkansas's gross domestic product. They include: food, beverages, and tobacco; the manufacture of primary metal and fabricated metal products; paper products; chemicals; plastics; and natural gas and crude oil extraction and mining.23 The transportation sector accounts for over one-fourth of the state's energy consumption, followed by the residential sector at one-fifth and the commercial sector at one-sixth.24
Natural gas
Arkansas accounts for about 1% of total U.S. marketed natural gas production and proved natural gas reserves.
Arkansas holds about 1% of the nation's proved natural gas reserves, and in 2023 the state accounted for 1% of total U.S. marketed gas production.25,26 Most of the state's natural gas production is from the Arkoma Basin in west-central Arkansas, although there are also gas wells in the southern part of the state. Most of the natural gas produced in southern Arkansas is associated with crude oil production that contains some heavier hydrocarbons, such as propane.27,28 The state's coal formations produce coalbed methane, and much of that methane production comes from the Lower Hartshorne coalbed located in west-central Arkansas along the state's border with Oklahoma.29,30,31 However, Arkansas is not a major producer of coalbed methane. The state accounts for just 0.1% of total U.S. coalbed methane output.32
Marketed natural gas production in Arkansas increased significantly beginning in 2008. Output more than doubled by 2012 because of horizontal drilling and hydraulic fracturing in the Fayetteville Shale, which accounts for most of the state's natural gas production.33,34,35 However, natural gas production in Arkansas has decreased every year since its 2012 peak.36 The state's natural gas output in 2023 was one-third of what it was in 2012 and fell to its lowest level since 2007.37
Arkansas produces more natural gas than it consumes.38,39 More than a dozen natural gas pipelines, mostly from Louisiana, Oklahoma, Mississippi, and Texas, pass through Arkansas on the way to markets in the Midwest and Northeast.40,41 Large volumes of natural gas flow into the state and even larger volumes move out, with supplies mostly going through Mississippi, Louisiana, and Missouri.42 The state has two natural gas storage fields that together can hold nearly 22 billion cubic feet of gas, which is about 0.2% of U.S. total underground storage capacity.43,44
In 2023, the electric power sector consumed about half of the natural gas delivered to consumers in Arkansas, as generation from natural gas-fired power plants in the state provided 39% of total electricity net generation.45,46 The industrial sector, which includes agriculture, accounted for 29% of the state's natural gas deliveries. The sector typically increases natural gas use during the fall months to dry the nation's largest harvested rice crop.47,48 The commercial sector accounted for about one-seventh of the state's gas deliveries. The residential sector, where about 4 in 10 Arkansas households use natural gas as their primary source for home heating, consumed about 7%.49,50
Petroleum
Arkansas's proved crude oil reserves are small, accounting for about 0.1% of the U.S. total, and the state produces about 0.1% of the nation's total crude oil output. Oil production has remained steady at 12,000 barrels per day since 2021, a decline from a peak of 82,000 barrels per day in 1960.51,52,53 Arkansas once played a larger role in the U.S. oil sector, leading the nation's crude oil production in the mid-1920s from its large Smackover oil field in the southern part of the state. Smackover remains the state's biggest crude oil producing field.54 However, many oil wells in the state are now stripper wells that produce less than 10 barrels of crude oil per day.55 Arkansas's crude oil production continues to be concentrated along the state's southern border.56
Arkansas has 2 oil refineries that have a combined processing capacity of almost 91,000 barrels of crude oil per calendar day, which equals less than 1% of U.S. total refining capacity. The larger refinery in El Dorado can process about 83,000 barrels of crude oil per calendar day into motor gasoline, diesel fuel, propane, solvents, and asphalt products. The refinery processes crude oil produced in Arkansas and from other states and countries. The smaller refinery in Smackover processes about 7,500 barrels per calendar day and produces lubricants and process oils that are marketed to the tire, electrical, asphalt, and roofing industries.57,58,59,60
Arkansas’s biodiesel production capacity totals 75 million gallons annually, about 4% of U.S. total capacity.
The transportation sector accounts for about four-fifths of the petroleum consumed in Arkansas, and the industrial sector uses about one-seventh. The commercial and residential sectors account for most of the state's remaining petroleum use.61 About 6 out of 100 Arkansas households use petroleum products, mostly propane, for home heating.62 Arkansas allows statewide use of conventional motor gasoline without ethanol, although almost all U.S. gasoline contains at least 10% ethanol.63,64 Arkansas does not have any ethanol production plants, but the state does have two biodiesel manufacturing plants with a combined production capacity of 75 million gallons per year, about 4% of U.S. total capacity. Arkansas consumes much less biodiesel, about 20 million gallons annually.65,66,67
Electricity
In 2023, natural gas was the leading source of fuel for generating electricity in Arkansas.
In 2023, natural gas remained the leading fuel used to generate electricity in Arkansas and accounted for 39% of the state's total electricity net generation. Natural gas-fired generation exceeded the state's coal-fired generation in 2020 for the first time. Coal accounted for 27% of the state's generation in 2023.68
Natural gas fuels 5 of the 10 largest power plants by capacity in Arkansas, including the 2,000-megawatt Union Power Station, which is the largest power plant in the state. Coal fuels 4 of Arkansas's 10 largest power plants by capacity. The second-largest power plant is the state's one nuclear power plant—with two reactors—that provided about 24% of in-state net generation in 2023. The 1,822-megawatt nuclear power plant is located on Lake Dardanelle about 60 miles northwest of Little Rock. Almost all the rest of the state's electricity net generation came from renewables, mainly hydroelectric power, solar power, and biomass-fueled generating facilities.69,70,71,72
In 2022, Arkansas ranked 11th among the states in total electricity sales per capita and 6th in residential electricity sales per capita.73 The industrial and residential sectors each account for the largest share of electricity use in Arkansas, with 38% of the state's total power sales each. Slightly more than half of the households in the state use electricity as their primary energy source for home heating, and more than 90% of households use air conditioning. Arkansas ranks 11th among the states with the lowest average electricity prices. The commercial sector accounts for 24% of state electricity use.74,75,76,77,78
Coal
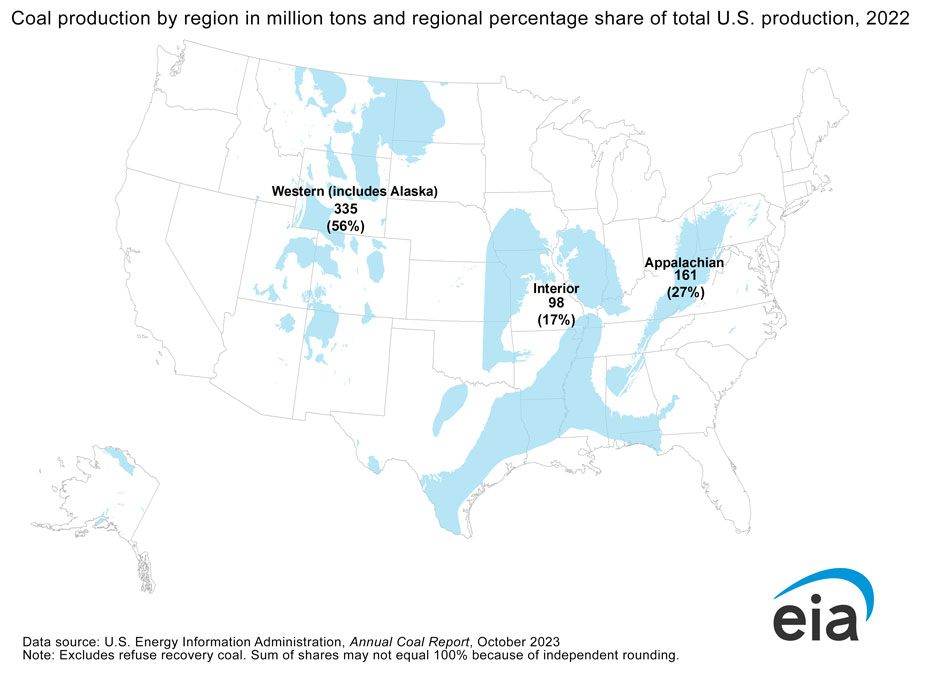
Coal was Arkansas's most valuable mineral resource from its first commercial production in the mid-19th century, but its importance diminished with the discovery of oil in the state in the 1920s and has continued to decrease because of the increased retirement of coal-fired power plants nationwide.79,80 Arkansas has 227 million tons of recoverable coal reserves, which is about 0.1% of the U.S. total. However, the state's last coal production occurred in 2017 at three small mines, all located in the Arkansas River Valley near the state's western border.81,82 In 2022, Arkansas was the 18th-largest coal-consuming state, using nearly 12.1 million tons. The electric power sector uses almost all the coal consumed in the state and it arrives by rail primarily from Wyoming. Industrial plants in the state also receive small amounts of coal by rail and truck from Utah, Colorado, Illinois, and Alabama.83,84
Renewable Energy
Renewable energy provided 9% of Arkansas’s total electricity net generation in 2023.
Renewable sources of energy provided 9% of the total electricity generated in Arkansas in 2023. Conventional hydroelectric power accounted for about two-thirds of the state's renewable generation. The state has 19 utility-scale (1 megawatt or larger) conventional hydroelectric power generating facilities and one hydroelectric pumped storage plant.85,86 Pumped storage plants pump water from a lower reservoir to an upper reservoir during periods of low demand for electricity, which is usually at night, when electricity is less costly. The water is released from the upper reservoir in periods when power demand and electricity prices are higher, usually during the day, the water is released from the upper reservoir and flows down through turbines on its way to the lower reservoir, producing electricity. Although the pumped storage plant uses more power than it generates, it supplies power in periods of peak demand when electricity prices are higher.87
In 2023, the amount of total electricity generated in Arkansas by solar energy continued to exceed biomass-fueled generation, and solar power accounted for about one-fifth of the state's renewable electricity.88 Arkansas's two largest solar farms each have 180 megawatts of generating capacity. The newest of the two is the Big Cypress Solar Farm, which came online in January 2024 in the eastern part of the state, covering about 1,550 acres.89 The Searcy Solar farm, located northeast of Little Rock, came online in January 2022, and has a generating capacity of 100 megawatts. It is the first solar farm in the state with battery storage and can store 30 megawatts of solar-generated electricity.90 Over 1,100 megawatts of solar power generating capacity is scheduled to come online in Arkansas in 2024 and another 400 megawatts in 2025.91
Biomass supplied 14% of Arkansas's total in-state renewable electricity in 2023, almost all of it from wood and wood-derived fuels.92 Solid biomass residues, including crop residues and methane from livestock manure, are other potential resources for electricity generation in the state.93,94 Arkansas's biomass resources also provide feedstock for the state's one wood pellet manufacturing plant, which has a production capacity of 744,000 tons per year. It is the third-largest wood pellet plant in the nation.95 Wood pellets are used for heating and electricity generation.96
Arkansas does not generate any electricity from utility-scale wind power facilities, although it has moderate wind energy resources in the Ozark Mountains in the northwest corner of the state.97,98,99
Arkansas does not have a renewable portfolio standard that requires the state's electricity providers to generate a certain amount of electricity from renewable energy sources.100 However, the state does have net metering, allowing households with small, customer-sited solar panels, wind turbines, or other renewable power generating installations no larger than 25 kilowatts in size to receive credits from utilities for excess electricity sent to the grid. Businesses with renewable electric generating systems that are up to 1 megawatt in capacity are also eligible for net metering. In March 2023, the Arkansas legislature passed legislation that was signed into law reducing the credit that new net-metering customers receive for their surplus power and increasing the size of eligible business renewable generating systems to 5 megawatts.101,102
In 2010, the Arkansas Public Service Commission (APSC) implemented an energy efficiency resource standard that required the state's investor-owned electric and natural gas utilities to undertake energy efficiency measures. In January 2023, the APSC extended through 2026 the targets calling for a 1.2% reduction in utility sales of electricity and a 0.5% reduction in utility sales of natural gas from 2018 levels.103,104 In 2023, Arkansas launched the Electric Vehicle Infrastructure Deployment Plan to ensure a reliable, affordable, and equitable electric vehicle charging network.105,106 As of May 2024, Arkansas had 327 public-only electric vehicle charging locations and 8 combined public and private locations.107 The majority of these are clustered around Little Rock and Fayetteville.108
Endnotes
1 Arkansas PBS, Arkansas: A Six Region Journey, accessed June 4, 2024.
2 Arkansas State Parks, Crater of Diamonds State Park, Crater of the Diamonds State Park History, accessed April June 4, 2024.
3 State Symbols USA, Flag of Arkansas, accessed June 4, 2024.
4 World Atlas, Arkansas, Arkansas Geography, accessed June 4, 2024.
5 Foti, Thomas, Arkansas Valley, The Encyclopedia of Arkansas History and Culture, updated January 29, 2024.
6 Arkansas Geological Survey, General Information Regarding Natural Gas in Arkansas, accessed June 4, 2024.
7 Arkansas Geological Survey, General Information Regarding Coal in Arkansas, accessed June 4, 2024.
8 U.S. EIA, U.S. Energy Atlas, All Energy Infrastructure and Resources, Arkansas, accessed June 4, 2024.
9 Arkansas Geological Survey, General Information Regarding Crude Oil in Arkansas, History of Discovery and Exploration, accessed June 4, 2024.
10 U.S. EIA, U.S. Energy Atlas, All Energy Infrastructure and Resources, Arkansas, accessed June 4, 2024.
11 Reynolds, Jerry, Hydroelectricity, The Encyclopedia of Arkansas History and Culture, updated November 30, 2023.
12 Stroud, Hubert, Mississippi Alluvial Plain, The Encyclopedia of Arkansas History and Culture, updated January 23, 2024.
13 Foti, Thomas, Geography and Geology, The Encyclopedia of Arkansas History and Culture, updated December 4, 2023.
14 Buckner, Ed, Climate and Weather, The Encyclopedia of Arkansas History and Culture, updated October 13, 2022.
15 Arkansas Department of Agriculture, Forestry, Arkansas's Forest Fact Sheets, AR Forest Inventory Fact Sheet 2022.
16 National Renewable Energy Laboratory, Geospatial Data Science, Biomass Resource Data, Tools, and Maps, U.S. Biomass Resource Maps, accessed April 13, 2023.
17 Arkansas Department of Agriculture, Forestry Division, Forest Health Highlights for 2023.
18 U.S. EIA, State Energy Data System, Table P3, Total Primary Energy Production and Total Energy Consumption Estimates in Trillion Btu, 2022.
19 U.S. EIA, State Energy Data System, Table C14, Total Energy Consumption Estimates per Capita by End-Use Sector, Ranked by State, 2022.
20 U.S. EIA, State Energy Data System, Table C11, Energy Consumption Estimates by End-Use Sector, Ranked by State, 2022.
21 U.S. Department of Agriculture, 2023 State Agricultural Overview, Arkansas.
22 Farm Bureau Arkansas, Arkansas Agriculture, Poultry, accessed June 4, 2024.
23 U.S. Bureau of Economic Analysis, Interactive Data, Regional Data, GDP and Personal Income, Annual Gross Domestic Product by State, GDP in Current Dollars, NAICS, Arkansas, All Statistics in Table, 2023.
24 U.S. EIA, State Energy Data System, Table C11, Energy Consumption Estimates by End-Use Sector, Ranked by State, 2022.
25 U.S. EIA, U.S. Crude Oil and Natural Gas Proved Reserves, Year-end 2022 (April 29, 2024), Table 10, Proved reserves, reserves changes, and production of natural gas, wet after lease separation, 2022.
26 U.S. EIA, Natural Gas Gross Withdrawals and Production, Marketed Production, Annual, 2017-23.
27 Arkansas Geological Survey, General Information Regarding Natural Gas in Arkansas, Conventional Gas, accessed June 5, 2024.
28 U.S. EIA, U.S. Energy Atlas, All Energy Infrastructure and Resources, Arkansas, accessed June 5, 2024.
29 Arkansas Geological Survey, General Information Regarding Natural Gas in Arkansas, Unconventional Gas, Coalbed Natural Gas Methane, accessed June 5, 2024.
30 Arkansas Geological Survey, Major Producing Formations in North Arkansas, Pennsylvanian (Morrow, Atoka, Hartshorne Coal), accessed June 5, 2024.
31 Arkansas Oil and Gas Commission-Oil and Gas Info, Map, accessed June 5, 2024.
32 U.S. EIA, Natural Gas Gross Withdrawals and Production, Gross Withdrawals from Coalbed Wells, Annual, 2017-2022.
33 U.S. EIA, Arkansas Natural Gas Marketed Production, Annual, 1967-2023.
34 U.S. EIA, Arkansas Shale Production, 2007-21.
35 Arkansas Geological Survey, General Information Regarding Natural Gas in Arkansas, Fayetteville Shale Gas, accessed June 5, 2024.
36 Brown, Wesley, "Arkansas natural gas sales, production see steady decline," Talk Business & Politics (August 21, 2019).
37 U.S. EIA, Arkansas Natural Gas Marketed Production, Annual, 1967-2023.
38 U.S. EIA, Arkansas Natural Gas Marketed Production, Annual, 1967-2023.
39 U.S. EIA, Natural Gas Consumption by End Use, Arkansas, Annual, 2016-23.
40 U.S. Department of Transportation, Gas Transmission Pipelines, Pipeline data as of 10/1/2019.
41 U.S. EIA, U.S. Energy Atlas, All Energy Infrastructure and Resources, Arkansas, accessed June 5, 2024.
42 U.S. EIA, International and Interstate Movements of Natural Gas by State, Arkansas, 2016-22.
43 U.S. EIA, Underground Natural Gas Storage Capacity, Total Number of Existing Fields, 2016-22.
44 U.S. EIA, Underground Natural Gas Storage Capacity, Total Storage Capacity, 2016-22.
45 U.S. EIA, Natural Gas Consumption by End Use, Arkansas, Annual 2018-23.
46 U.S. EIA, Electricity Data Browser, Net generation for all sectors, thousand megawatthours, Arkansas, Annual 2020-23.
47 U.S. EIA, Natural Gas Consumption by End Use, Arkansas, Annual 2018-23.
48 USA Rice, Where Rice Grows, accessed June 5, 2024.
49 U.S. Census Bureau, House Heating Fuel, Table B25040, 2022 ACS 1-Year Estimates Detailed Tables, Arkansas.
50 U.S. EIA, Natural Gas Consumption by End Use, Arkansas, Annual 2018-23.
51 U.S. EIA, Crude Oil Proved Reserves, Reserves Changes, and Production, Proved Reserves as of 12/31, 2016-21.
52 U.S. EIA, Arkansas Field Production of Crude Oil, Annual-Thousand Barrels per Day, 2018-23.
53 U.S. EIA, State Energy Production Estimates 1960 Through 2022, Table PT1, Primary Energy Production Estimates in Physical Units, Arkansas, 1960-2022, p. 22.
54 Lambert, Don, Smackover (Union County), The Encyclopedia of Arkansas, updated July 19, 2023.
55 Arkansas Geological Survey, General Information Regarding Crude Oil in Arkansas, History of Discovery and Exploration, accessed June 6, 2024.
56 U.S. EIA, U.S. Energy Atlas, All Energy Infrastructure and Resources, Arkansas, accessed June 6, 2024.
57 U.S. EIA, Refinery Capacity Report 2022 (June 21, 2023), Table 3, Capacity of Operable Petroleum Refineries by State as of January 1, 2023.
58 U.S. EIA, State Energy Data System, Table F16, Total Petroleum Consumption Estimates, 2022.
59 Lion Oil, About, accessed June 6, 2024.
60 Cross Oil Refining and Marketing, About, accessed June 6, 2024.
61 U.S. EIA, State Energy Data System, Table F16, Total Petroleum Consumption Estimates, 2022.
62 U.S. Census Bureau, House Heating Fuel, Table B25040, 2022 ACS 1-Year Estimates Detailed Tables, Arkansas.
63 American Petroleum Institute, U.S. Gasoline Requirements, January 2018.
64 U.S. EIA, "New EPA ruling expands sale of 15% ethanol blended motor gasoline," Today in Energy (July 16, 2019).
65 U.S. EIA, U.S. Fuel Ethanol Plant Production Capacity (August 7, 2023), Detailed annual production capacity by plants is available in XLSX.
66 U.S. EIA, U.S. Biodiesel Plant Production Capacity (August 7, 2023), Detailed annual production capacity by plant is available in XLSX.
67 U.S. EIA, State Energy Data System, Table F26, Biodiesel Consumption Estimates, 2022.
68 U.S. EIA, Electricity Data Browser, Net generation for all sectors, thousand megawatthours, Arkansas, Annual 2020-23.
69 U.S. EIA, Arkansas Electricity Profile 2022, Table 2A, Ten Largest Plants by Capacity, 2022.
70 U.S. EIA, Nuclear Reactor, State, and Net Capacity (September 2023).
71 U.S. EIA, Electricity Data Browser, Net generation for all sectors, thousand megawatthours, Arkansas, Annual 2020-23.
72 Entergy, Arkansas Nuclear One, accessed June 7, 2024.
73 U.S. EIA, Table C17, Electricity Sales to Ultimate Customers, Total and Residential, Total and per Capita, Ranked by State, 2022.
74 U.S. EIA, Electricity Data Browser, Retail sales of electricity (million kilowatthours), Arkansas, 2020-23.
75 U.S. Census Bureau, House Heating Fuel, Table B25040, 2022 ACS 1-Year Estimates Detailed Tables, Arkansas.
76 U.S. EIA, Table C17, Electricity Sales to Ultimate Customers, Total and Residential, Total and per Capita, Ranked by State, 2022.
77 U.S. EIA, 2020 RECS Survey Data, State Data, Housing Characteristics, Highlights for air conditioning in U.S. homes by state, 2020.
78 U.S. EIA, Electric Power Monthly (February 2024), Table 5.6.B.
79 Arkansas Geological Survey, General Information Regarding Coal in Arkansas, accessed June 7, 2024.
80 U.S. EIA, "U.S. coal-fired electricity generation decreased in 2022 and 2023," Today in Energy (May 10, 2024).
81 U.S. EIA, Annual Coal Report 2022 (October 3, 2023), Table 1, Coal Production and Number of Mines by State and Mine Type, 2022 and 2021, Table 15, Recoverable Coal Reserves at Producing Mines, Estimated Recoverable Reserves, and Demonstrated Reserve Base by Mining Method, 2021.
82 U.S. EIA, Annual Coal Report 2018, Table 1, Coal Production and Number of Mines by State and Mine Type, 2018 and 2017.
83 U.S. EIA, Annual Coal Report 2022 (October3, 2023), Table 26, U.S. Coal Consumption by End Use Sector, Census Division, and State, 2022 and 2021.
84 U.S. EIA, Annual Coal Distribution Report 2022 (October 3, 2023), Domestic distribution of U.S. coal by destination state, Arkansas, Table DS-4, Domestic Coal Distribution, by Destination State, 2022.
85 U.S. EIA, Electricity Data Browser, Net generation for all sectors, thousand megawatthours, Arkansas, Annual 2020-23.
86 U.S. EIA, Preliminary Monthly Electric Generator Inventory (based on Form EIA-860M as a supplement to Form EIA-860), Inventory of Operating Generators as of April 2024, Plant State: Arkansas, Technology: Conventional Hydroelectric and Hydroelectric Pumped Storage.
87 U.S. EIA, Energy Explained, Hydropower explained, updated April 20, 2023.
88 U.S. EIA, Electricity Data Browser, Net generation for all sectors, thousand megawatthours, Arkansas, Annual, 2019-22.
89 NextEra Energy, Inc., Big Cypress Solar Energy Center, accessed June 12, 2024.
90 Entergy Corporation, "Entergy Arkansas Searcy Solar Energy Center Now Online," Press release (January 27, 2022).
91 U.S. EIA, Preliminary Monthly Electric Generator Inventory (based on Form EIA-860M as a supplement to Form EIA-860), Inventory of Operating Generators as of April 2024, Plant State: Arkansas, Technology: Solar Photovoltaic, Batteries; Inventory of Planned Generators as of April 2024, Plant State: Arkansas, Technology: Solar Photovoltaic.
92 U.S. EIA, Electricity Data Browser, Net generation for all sectors, thousand megawatthours, Arkansas, Annual 2020-23.
93 University of Arkansas, Division of Agriculture, Research & Extension, Bioenergy Crops, accessed June 13, 2024.
94 U.S. Department of Agriculture, 2023 State Agricultural Overview, Arkansas, accessed June 13, 2024.
95 U.S. EIA, Monthly Densified Biomass Fuel Report (June 3, 2024), Table 1, Densified biomass fuel manufacturing facilities in the United States by state, region, and capacity, March 2024, Download.
96 University of Tennessee, Wood Products Information, Wood Pellets - An introduction to their production and use, accessed June 13, 2024.
97 U.S. EIA, Electricity Data Browser, Net generation for all sectors, thousand megawatthours, Arkansas, Annual 2020-23.
98 U.S. Department of Energy, Office of Energy Efficiency and Renewable Energy, WindExchange, Wind Energy in Arkansas, Maps & Data, accessed June 13, 2024.
99 U.S. Department of Energy, Office of Energy Efficiency & Renewable Energy, U.S. Wind Power Resource at 100-Meter Hub Height, accessed June 13, 2024.
100 National Conference of State Legislatures, State Renewable Portfolio Standards and Goals, updated August 13, 2021.
101 North Carolina Clean Energy Technology Center, DSIRE, Net Metering, updated January 5, 2024.
102 University of Arkansas, Division of Agriculture, Research & Extension, Net Metering Policies, accessed June 13, 2024.
103 Arkansas Public Service Commission, APSC Sustainable Energy Resources (SER) Action Guide, Docket No. 08-144-U (December 2010).
104 North Carolina Clean Energy Technology Center, DSIRE, Arkansas Energy Efficiency Targets, updated February 16, 2023.
105 Arkansas Department of Transportation, Transportation Planning & Policy, Electric Vehicle Infrastructure Deployment Plan, accessed June 13, 2024.
106 U.S. Department of Energy, Alternative Fuels Data Center, Arkansas Laws and Incentives, accessed June 13, 2024.
107 U.S. EIA, Monthly Energy Review (June 2024), Appendix F monthly state file, XLS.
108 U.S. Department of Energy, Alternative Fuels Data Center, Electric Vehicle Charging Station Locations, Arkansas, Map Results, accessed June 13, 2024.
Other Resources
Energy-Related Regions and Organizations
- Coal Region: Interior
- Petroleum Administration for Defense District (PADD): 3
- Regional Transmission Organization (RTO) and Independent System Operator (ISO): Midcontinent Independent System Operator (MISO), Southwest Power Pool (SPP)
- North American Electric Reliability Corporation (NERC) ERO Enterprise: Regional Entities: SERC Reliability Corporation (SERC)
Other Websites
- Arkansas Energy Office
- Arkansas Public Service Commission
- Arkansas Oil and Gas Commission
- Electric Cooperatives of Arkansas
- Arkansas Geological Survey
- Arkansas Department of Energy and Environment, Energy Resources Council
- Arkansas Department of Energy and Environment, Coal Program
- Arkansas Liquefied Petroleum Gas Board
- Southern States Energy Board
- EIA Arkansas Flickr Album
- U.S. Department of Agriculture, Rural Energy for America Program, Renewable Energy Systems & Energy Efficiency Improvement Loans & Grants in Arkansas
- Alternative Fuels Data Center, Federal and State Laws and Incentives
- Southwestern Power Administration
- Benefits.Gov, Housing and Public Utilities
- NC Clean Energy Technology Center, Database of State Incentives for Renewables and Efficiency (DSIRE)
- National Association of Regulatory Utility Commissioners (NARUC)
- National Association of State Energy Officials (NASEO)
- National Conference of State Legislatures (NCSL), Research and Policy
- National Renewable Energy Laboratory (NREL), Geospatial Data Science Data and Tools
- U.S. Geological Survey (USGS), Publications
- Interstate Oil and Gas Compact Commission (IOGCC)
- U.S. Department of Health & Human Services, Office of Community Services, An Office of the Administration for Children & Families, Low Income Home Energy Assistance Program (LIHEAP)
- U.S. Geological Survey, Maps
- Lawrence Livermore National Laboratory, Energy Flow Charts
- National Renewable Energy Laboratory, State and Local Planning for Energy (SLOPE)
- EIA Status of U.S. Nuclear Outages
- EIA Natural Gas Storage Dashboard
- EIA Energy Disruptions
- U.S. Department of Agriculture (USDA), Rural Development, Energy Programs