Rhode Island Quick Facts
- In May 2017, the first U.S. offshore wind farm began operating off Block Island. Wind power provided 2.5% of Rhode Island's net generation in 2021.
- Rhode Island consumes the lowest amount energy on a per capita basis and is among the 10 states that use the least amount of energy per dollar of gross domestic product (GDP).
- About 30% of Rhode Island households use heating oil and other petroleum products as their primary source for home heating, which is 3 times more than the U.S. rate. The 1-million-barrel Northeast Home Heating Oil Reserve can help offset supply disruptions in the region.
- In 2022, natural gas fueled 83% of Rhode Island's electricity net generation, the second-largest share of any state after Delaware.
- Rhode Island uses less total petroleum than all others states, except for Vermont, and is second-lowest, after New York, in petroleum use on a per capita basis.
Last Updated: November 16, 2023
Data
Last Update: April 18, 2024 | Next Update: May 16, 2024
| Prices | |||||
|---|---|---|---|---|---|
| Petroleum | Rhode Island | U.S. Average | Period | find more | |
| Domestic Crude Oil First Purchase | -- | $ 72.26 /barrel | Jan-24 | ||
| Natural Gas | Rhode Island | U.S. Average | Period | find more | |
| City Gate | $ 7.69 /thousand cu ft | $ 4.76 /thousand cu ft | Jan-24 | find more | |
| Residential | $ 18.66 /thousand cu ft | $ 11.82 /thousand cu ft | Jan-24 | find more | |
| Coal | Rhode Island | U.S. Average | Period | find more | |
| Average Sales Price | -- | $ 54.46 /short ton | 2022 | ||
| Delivered to Electric Power Sector | -- | $ 2.48 /million Btu | Jan-24 | ||
| Electricity | Rhode Island | U.S. Average | Period | find more | |
| Residential | 31.22 cents/kWh | 15.45 cents/kWh | Jan-24 | find more | |
| Commercial | 21.20 cents/kWh | 12.68 cents/kWh | Jan-24 | find more | |
| Industrial | 20.38 cents/kWh | 8.10 cents/kWh | Jan-24 | find more | |
| Reserves | |||||
|---|---|---|---|---|---|
| Reserves | Rhode Island | Share of U.S. | Period | find more | |
| Crude Oil (as of Dec. 31) | -- | -- | 2021 | find more | |
| Expected Future Production of Dry Natural Gas (as of Dec. 31) | -- | -- | 2021 | find more | |
| Expected Future Production of Natural Gas Plant Liquids | -- | -- | 2021 | find more | |
| Recoverable Coal at Producing Mines | -- | -- | 2022 | find more | |
| Rotary Rigs & Wells | Rhode Island | Share of U.S. | Period | find more | |
| Natural Gas Producing Wells | -- | -- | 2020 | find more | |
| Capacity | Rhode Island | Share of U.S. | Period | ||
| Crude Oil Refinery Capacity (as of Jan. 1) | -- | -- | 2023 | ||
| Electric Power Industry Net Summer Capacity | 2,292 MW | 0.2% | Jan-24 | ||
| Supply & Distribution | |||||
|---|---|---|---|---|---|
| Production | Rhode Island | Share of U.S. | Period | find more | |
| Total Energy | 12 trillion Btu | * | 2021 | find more | |
| Crude Oil | -- | -- | Jan-24 | find more | |
| Natural Gas - Marketed | -- | -- | 2022 | find more | |
| Coal | -- | -- | 2022 | find more | |
| Total Utility-Scale Net Electricity Generation | Rhode Island | Share of U.S. | Period | find more | |
| Total Net Electricity Generation | 578 thousand MWh | 0.2% | Jan-24 | ||
| Utility-Scale Net Electricity Generation (share of total) | Rhode Island | U.S. Average | Period | ||
| Petroleum-Fired | 0.7 % | 0.4 % | Jan-24 | find more | |
| Natural Gas-Fired | 87.4 % | 42.2 % | Jan-24 | find more | |
| Coal-Fired | 0.0 % | 19.9 % | Jan-24 | find more | |
| Nuclear | 0.0 % | 18.2 % | Jan-24 | find more | |
| Renewables | 11.8 % | 18.8 % | Jan-24 | ||
| Stocks | Rhode Island | Share of U.S. | Period | find more | |
| Motor Gasoline (Excludes Pipelines) | -- | -- | Jan-24 | ||
| Distillate Fuel Oil (Excludes Pipelines) | 761 thousand barrels | 0.8% | Jan-24 | find more | |
| Natural Gas in Underground Storage | -- | -- | Jan-24 | find more | |
| Petroleum Stocks at Electric Power Producers | 122 thousand barrels | 0.5% | Jan-24 | find more | |
| Coal Stocks at Electric Power Producers | 0 thousand tons | 0.0% | Jan-24 | find more | |
| Fueling Stations | Rhode Island | Share of U.S. | Period | ||
| Motor Gasoline | 291 stations | 0.3% | 2021 | ||
| Propane | 5 stations | 0.2% | Mar-24 | ||
| Electric Vehicle Charging Locations | 315 stations | 0.5% | Mar-24 | ||
| E85 | 0 stations | 0.0% | Mar-24 | ||
| Biodiesel, Compressed Natural Gas, and Other Alternative Fuels | 1 stations | * | Mar-24 | ||
| Consumption & Expenditures | |||||
|---|---|---|---|---|---|
| Summary | Rhode Island | U.S. Rank | Period | ||
| Total Consumption | 186 trillion Btu | 49 | 2021 | find more | |
| Total Consumption per Capita | 170 million Btu | 51 | 2021 | find more | |
| Total Expenditures | $ 3,737 million | 49 | 2021 | find more | |
| Total Expenditures per Capita | $ 3,406 | 44 | 2021 | find more | |
| by End-Use Sector | Rhode Island | Share of U.S. | Period | ||
| Consumption | |||||
| » Residential | 62 trillion Btu | 0.3% | 2021 | find more | |
| » Commercial | 48 trillion Btu | 0.3% | 2021 | find more | |
| » Industrial | 22 trillion Btu | 0.1% | 2021 | find more | |
| » Transportation | 54 trillion Btu | 0.2% | 2021 | find more | |
| Expenditures | |||||
| » Residential | $ 1,316 million | 0.5% | 2021 | find more | |
| » Commercial | $ 804 million | 0.4% | 2021 | find more | |
| » Industrial | $ 335 million | 0.1% | 2021 | find more | |
| » Transportation | $ 1,282 million | 0.2% | 2021 | find more | |
| by Source | Rhode Island | Share of U.S. | Period | ||
| Consumption | |||||
| » Petroleum | 15 million barrels | 0.2% | 2021 | find more | |
| » Natural Gas | 91 billion cu ft | 0.3% | 2022 | find more | |
| » Coal | 0 thousand short tons | 0.0% | 2022 | find more | |
| Expenditures | |||||
| » Petroleum | $ 1,834 million | 0.2% | 2021 | find more | |
| » Natural Gas | $ 1,053 million | 0.4% | 2022 | find more | |
| » Coal | -- | -- | 2022 | find more | |
| Consumption for Electricity Generation | Rhode Island | Share of U.S. | Period | find more | |
| Petroleum | 8 thousand barrels | 0.3% | Jan-24 | find more | |
| Natural Gas | 4,020 million cu ft | 0.3% | Jan-24 | find more | |
| Coal | 0 thousand tons | 0.0% | Jan-24 | find more | |
| Energy Source Used for Home Heating (share of households) | Rhode Island | U.S. Average | Period | ||
| Natural Gas | 53.9 % | 46.2 % | 2022 | ||
| Fuel Oil | 25.1 % | 3.9 % | 2022 | ||
| Electricity | 13.6 % | 41.3 % | 2022 | ||
| Propane | 4.9 % | 5.0 % | 2022 | ||
| Other/None | 2.5 % | 3.5 % | 2022 | ||
| Environment | |||||
|---|---|---|---|---|---|
| Renewable Energy Capacity | Rhode Island | Share of U.S. | Period | find more | |
| Total Renewable Energy Electricity Net Summer Capacity | 509 MW | 0.2% | Jan-24 | ||
| Ethanol Plant Nameplate Capacity | -- | -- | 2023 | ||
| Renewable Energy Production | Rhode Island | Share of U.S. | Period | find more | |
| Utility-Scale Hydroelectric Net Electricity Generation | NM | NM | Jan-24 | ||
| Utility-Scale Solar, Wind, and Geothermal Net Electricity Generation | 46 thousand MWh | 0.1% | Jan-24 | ||
| Utility-Scale Biomass Net Electricity Generation | 21 thousand MWh | 0.5% | Jan-24 | ||
| Small-Scale Solar Photovoltaic Generation | 44 thousand MWh | 0.9% | Jan-24 | ||
| Fuel Ethanol Production | 0 thousand barrels | 0.0% | 2021 | ||
| Renewable Energy Consumption | Rhode Island | U.S. Rank | Period | find more | |
| Renewable Energy Consumption as a Share of State Total | 7.8 % | 36 | 2021 | ||
| Fuel Ethanol Consumption | 883 thousand barrels | 47 | 2021 | ||
| Total Emissions | Rhode Island | Share of U.S. | Period | find more | |
| Carbon Dioxide | 10.6 million metric tons | 0.2% | 2021 | ||
| Electric Power Industry Emissions | Rhode Island | Share of U.S. | Period | find more | |
| Carbon Dioxide | 2,949 thousand metric tons | 0.2% | 2022 | ||
| Sulfur Dioxide | 0 thousand metric tons | 0.0% | 2022 | ||
| Nitrogen Oxide | 2 thousand metric tons | 0.2% | 2022 | ||
Analysis
Last Updated: November 16, 2023
Overview
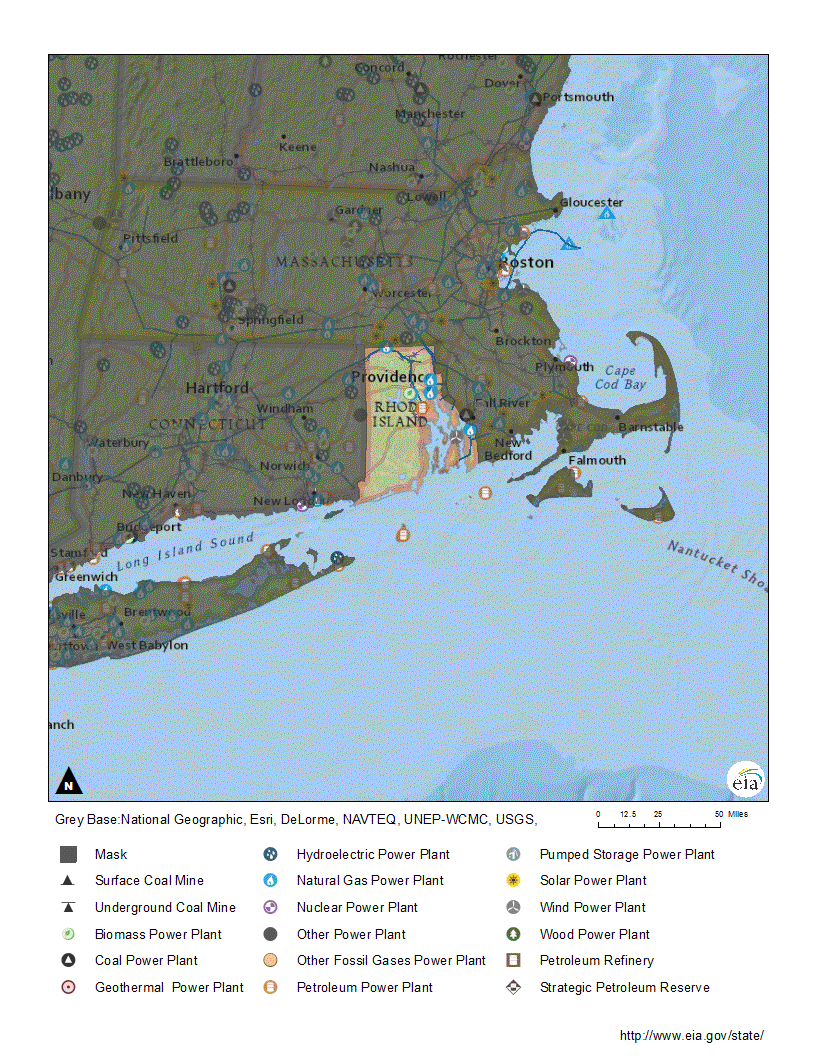
Known as the Ocean State, Rhode Island is one-third water and includes one of New England's deepwater ports at Providence.1,2 The state's mainland wraps around Narragansett Bay with its many islands, and includes Block Island off the coast. 3,4,5 Rhode Island is the smallest state in the nation by land area, and it is the second-most densely populated, after New Jersey. The state has nearly 1,100 people per square mile.6,7 Rhode Island has substantial renewable energy potential, particularly from winds offshore and along its extensive shoreline. But like the rest of the New England region, the state does not have any economically recoverable fossil energy resources.8,9,10,11
Rhode Island consumes less energy per capita than any other state.
Rhode Island consumes the least amount of energy among the states on a per capita basis, due in part to its small size.12 It also has one of the least energy-intensive economies. Rhode Island ranks among the ten states using the smallest amount of energy to produce a dollar of gross domestic product (GDP), in part because only about one-tenth of the state's GDP comes from manufacturing.13,14 The largest contributors to Rhode Island's GDP are finance, insurance, and real estate; professional and business services; government; and education, healthcare, and social assistance. The state's industrial activities include the manufacture of chemicals; food and beverages; computers and electronic equipment; petroleum products; machinery; and transportation equipment.15
Rhode Island summers are typically temperate, particularly in the ocean-moderated areas. Heavy snows can occur in winter, especially in the western third of the state where the terrain rises to 800 feet above sea level.16 The residential sector leads Rhode Island's end-use energy consumption, accounting for about one-third of the state's total, the third-highest share in the nation for a state's residential sector energy use after Connecticut and Vermont. The transportation sector is a close second, making up about three-tenths of the state's energy use. The commercial sector accounts for about one-fourth of the state's energy consumption, and the industrial sector accounts for about one-tenth.17
Electricity
Rhode Island’s share of natural gas-fired generation is the second largest among the states.
In 2022, Rhode Island generated 83% of its electricity from natural gas, the second-largest share of any state, after Delaware. Most of the rest of the state's net generation came from solar, biomass, and wind resources. A small amount of the state's electricity was also generated from petroleum and hydropower.18,19 Rhode Island is a member of the Regional Greenhouse Gas Initiative (RGGI), a market-based program to reduce carbon emissions from electricity generation in 12 northeastern and Mid-Atlantic states.20 Rhode Island is the nation's second-lowest energy-related carbon dioxide emitter, after Vermont, due in part to its low energy use and because of the state's small size.21,22
Rhode Island's total per capita electricity sales are lower than in all but two other states, California and Hawaii, and its per capita electricity sales to the residential sector are lower than in all but four states.23,24 With fewer than 10 days of temperatures above 90°F in a typical summer, air conditioning use in Rhode Island is limited, as less than one-third of households have central air conditioning. About 14 in 100 state households use electricity as their primary energy source for home heating.25,26,27
Independent power producers account for all of the electricity generated by Rhode Island's electric power sector.28 The previous exception was on Block Island—located about 9 miles south of the state's coastline—which was not connected to the mainland grid and was dependent on local diesel-fueled generators. Generator fuel arrived in trucks ferried to the island. Because fuel prices sometimes caused Block Island's electricity costs to rise to more than four times the state's average, particularly in summer when rates and electricity demand increased with the influx of tourists, the island participated in the nation's first offshore wind project.29,30 In May 2017, Block Island Power turned off its diesel generators and began receiving power from an undersea cable installed between the offshore wind farm, Block Island, and the mainland. The cable also allowed electricity generated on the mainland to reach Block Island for the first time and allowed the wind-generated electric power to be sent to the onshore grid.31,32,33
Renewable energy
In 2022, solar power accounted for nearly two-thirds of Rhode Island’s total electricity generated by renewable energy.
In 2022, about 16% of Rhode Island's in-state electricity came from utility-scale (1 megawatt or larger) and small-scale (less than 1 megawatt) generating facilities that produced power from renewable energy sources, with about two-thirds of that from solar energy. Wind energy and biomass generated most of the rest of the state's renewable electricity, and a small amount came from hydropower.34
Solar energy's contribution to the amount of electricity generated in Rhode Island has almost quadrupled since 2019 and accounted for 11% of the state's total generation in 2022.35 The state had almost 690 megawatts of solar generating capacity in mid-2023, and about three-fifths of it was small-scale solar panel systems with less than 1 megawatt of generating capacity each.36 The state's largest solar generating facility, which has a capacity of 24 megawatts, came online in December 2019. A 40-megawatt solar farm built at a former gravel pit is scheduled to come online at the end of 2023.37,38
Biomass accounted for about 2.6% of Rhode Island's total generation in 2022.39 The state's largest onshore renewable electricity generating station is a 31-megawatt biomass-fueled power plant that uses methane produced from a Providence landfill. A second, smaller landfill gas facility has a capacity of about 6 megawatts.40 Rhode Island also has two utility-scale hydroelectric power plants along its northern border. Each of those hydroelectric facilities has a generating capacity of less than 2 megawatts and combined accounted for about 0.1% of the state's generation.41,42,43
In 2016, Rhode Island became home to the first offshore wind farm in the nation: the 30-megawatt, 5-turbine Block Island project.44,45 With the advent of offshore generation, wind-powered electricity generation in Rhode Island increased rapidly in recent years. Wind power provided about 2.5% of the state's net generation in 2022.46 In mid-2023, the state had 48 megawatts of generating capacity at 18 onshore wind farms. The 715-megawatt Revolution Wind project is planned in federal waters 15 miles south of the Rhode Island coastline and is expected to be operational in early 2025. The offshore wind farm is expected to generate 400 megawatts of wind power for Rhode Island and more than 300 megawatts for Connecticut.47,48 To help mitigate the rising costs of offshore wind power projects, Rhode Island, Connecticut, and Massachusetts agreed in October 2023 to jointly purchase 6,000 megawatts of offshore wind power from energy companies in 2024.49
In 2022, Rhode Island updated its renewable energy standard to require the state's electricity providers to obtain 28% of their power supply from renewable resources by the end of 2024 and 100% by the end of 2033.50,51
Petroleum
Rhode Island has no crude oil reserves and does not produce or refine petroleum, but the Port of Providence is a key hub for the distribution of petroleum products to southern New England.52,53,54 Almost all of the transportation and heating fuel products consumed in Rhode Island, eastern Connecticut, and parts of Massachusetts are supplied via marine shipments through the Port of Providence. The port area has refined petroleum product storage tanks and a petroleum product pipeline that runs from the port to central Massachusetts.55,56
Rhode Island uses less petroleum than all other states, except for Vermont, and is second-lowest, after New York, in petroleum use on a per capita basis.57 The transportation sector consumes about 66% of the petroleum used in Rhode Island, mostly as motor gasoline and diesel fuel.58,59 As in the surrounding states, the use of reformulated motor gasoline blended with ethanol is required statewide in Rhode Island year-round to reduce air pollution.60 The residential sector is the second-largest petroleum consumer in the state, accounting for about 19% of petroleum use.61 About 3 out of 10 Rhode Island households use petroleum products, mainly heating oil, as their primary source for home heating. This makes the state, like much of the U.S. Northeast, vulnerable to heating oil shortages and price spikes in the winter.62
To avert supply disruptions, the U.S. Department of Energy created the Northeast Home Heating Oil Reserve in 2000. The reserve contains 1 million barrels of heating fuel stored at three terminals, two in New England and one in New Jersey. Rhode Island sits between the two New England terminals, which are located in Connecticut and in Massachusetts. Together those two terminals contain 700,000 barrels of heating fuel.63,64 The combined consumption of petroleum in Rhode Island's industrial and commercial sectors is about 15% of the state's total petroleum use.65
Natural gas
Rhode Island does not have any natural gas reserves or production.66,67 The state's natural gas is supplied by two major interstate pipelines.68,69 The natural gas that enters the state is produced primarily from the Marcellus and Utica shale regions in Pennsylvania, West Virginia, and Ohio, and most of that natural gas reaches Rhode Island by pipeline through Connecticut.70,71 Nearly 70% of the natural gas that enters Rhode Island is sent on to Massachusetts.72
About half of Rhode Island households rely on natural gas for heating.
With almost all in-state electricity generation fueled by natural gas, about 60% of the natural gas consumed in Rhode Island went to the electric power sector in 2022.73,74 The residential sector, where slightly more than half of the state's households heat with natural gas, accounted for about 19% of natural gas use. The commercial sector made up 12% of the state's natural gas consumption, followed by the industrial sector at 9%.75,76 As high amounts of natural gas are used for electricity generation in Rhode Island and throughout New England, ensuring reliable natural gas supplies is a critical energy issue for the region because of limited pipeline capacity.77
Like the other New England states, Rhode Island does not have any natural gas underground storage sites and depends on natural gas from storage fields in other states to meet peak winter demand.78 Because of regional pipeline constraints, Rhode Island and other New England states have also received some natural gas arriving at liquefied natural gas (LNG) import terminals in Massachusetts.79,80 There is also an LNG vaporization facility in Portsmouth, Rhode Island that provides emergency heating fuel to Aquidneck Island in Narragansett Bay during the winter when necessary.81,82
Coal
Rhode Island has no economically recoverable coal reserves or mining, and it was one of only six states, along with Connecticut, Massachusetts, New York, Oregon, and Vermont, with no utility-scale coal-fired electricity generation in 2022.83,84 Providence was once one of the largest coal import centers in the Northeast and received more than one-tenth of the imported coal delivered to the eastern customs district in 2015. Coal imports into Providence decreased as demand for coal for electricity generation in New England fell, and there have been no coal imports received at the Providence seaport since 2016.85
Endnotes
1 NETSTATE, The State of Rhode Island and Providence Plantations, updated July 28, 2017.
2 Pilsch, Marty, "The Port of Providence, A multi-dimensional port," American Journal of Transportation (April 4, 2016).
3 U.S. Geological Survey, The USGS Water Science School, How much of your state is wet?, accessed October 2, 2023.
4 World Atlas, Rhode Island, accessed October 2, 2023.
5 Encyclopaedia Britannica, "Block Island," accessed October 2, 2023.
6 NETSTATE, The State of Rhode Island and Providence Plantations, updated July 28, 2017.
7 U.S. Census Bureau, Data, Historical Population Density Data (1910-2020).
8 U.S. Department of Energy, Energy Efficiency and Renewable Energy, WINDExchange, Wind Energy in Rhode Island, Maps & Data, accessed October 2, 2023.
9 U.S. Energy Information Administration (EIA), Crude Oil Proved Reserves, Reserves Changes, and Production, Proved Reserves as of 12/31, 2016-21.
10 U.S. EIA, Natural Gas Reserves Summary as of Dec. 31, Dry Natural Gas, 2016-21.
11 U.S. EIA, Annual Coal Report 2022 (October 3, 2023), Table 15, Recoverable Coal Reserves at Producing Mines, Estimated Recoverable Reserves, and Demonstrated Reserve Base by Mining Method, 2022.
12 U.S. EIA, State Energy Data System, Table C14, Total Energy Consumption Estimates per Capita by End-Use Sector, Ranked by State, 2021.
13 U.S. Bureau of Economic Analysis, Interactive Data, Regional Data, GDP and Personal Income, Annual Gross Domestic Product (GDP) by State, SAGPD4 GDP in Current Dollars, SAGDP2N - Gross domestic product (GDP) by state NAICS, Rhode Island, All statistics in the table, 2021.
14 U.S. EIA, State Energy Data System, Table C10, Total Energy Consumption Estimates, Real Gross Domestic Product (GDP), Energy Consumption Estimates per Real Dollar of GDP, Ranked by State, 2021.
15 U.S. Bureau of Economic Analysis, Interactive Data, Regional Data, GDP and Personal Income, Annual Gross Domestic Product (GDP) by State, SAGDP2 GDP in Current Dollars, Rhode Island, All statistics in the table, 2022.
16 Community Collaborative Rain, Hail and Snow Network, "Climate of Rhode Island," Rhode Island's Climate, The CoCoRaHS ‘State Climates' Series, accessed October 2, 2023.
17 U.S. EIA, State Energy Data System, Table C11, Total Energy Consumption Estimates by End-Use Sector, Ranked by State, 2021.
18 U.S. EIA, Electric Power Monthly (February 2023), Tables 1.3.B, 1.7.B.
19 U.S. EIA, Electricity Data Browser, Net generation for all sectors (thousand megawatthours), Rhode Island, 2019-22.
20 The Regional Greenhouse Gas Initiative, Welcome, accessed October 3, 2023.
21 U.S. EIA, Energy-Related CO2 Emission Data Tables, Table 1, State energy-related carbon dioxide emissions by year (1970-2019).
22 U.S. EIA, Table F33, Total Energy Consumption, Price, and Expenditure Estimates, 2021.
23 U.S. EIA, Electricity Data Browser, Retail sales of electricity (million kilowatthours), New England, Rhode Island, 2019-22.
24 U.S. EIA, State Energy Data System, Table C17, Electricity Retail Sales, Total and Residential, Total and per Capita, Ranked by State, 2021.
25 U.S. EIA, Residential Energy Consumption Survey (RECS), 2020 RECS Survey Data, State Data, Housing characteristics, Highlights for air conditioning in U.S. homes by state, 2020.
26 Community Collaborative Rain, Hail and Snow Network, "Climate of Rhode Island," Rhode Island's Climate, The CoCoRaHS ‘State Climates' Series, accessed October 3, 2023.
27 U.S. Census Bureau, House Heating Fuel, Table B25040, 2022 ACS 1-Year Estimates Detailed Tables, Rhode Island.
28 U.S. EIA, Electric Power Monthly (February 2023), Table 1.3.B.
29 Encyclopaedia Britannica, "Block Island," accessed October 3, 2023.
30 "From Diesel to Wind on Block Island," Rocky Mountain Institute (June 19, 2015).
31 Block Island Power Company, The Company, accessed October 3, 2023.
32 McKenna, Phil, "America's First Offshore Wind Energy Makes Landfall in Rhode Island," Inside Climate News (May 1, 2017).
33 Harvey, Abby, "Nation's First Offshore Wind Farm Releases Community from Decades of Diesel," Power Magazine (December 1, 2017).
34 U.S. EIA, Electricity Data Browser, Net generation for all sectors (thousand megawatthours), Rhode Island, 2019-22.
35 U.S. EIA, Electricity Data Browser, Net generation for all sectors (thousand megawatthours), Rhode Island, 2019-22.
36 U.S. EIA, Electric Power Monthly (July 2023), Table 6.2.B.
37 U.S. EIA, Preliminary Monthly Electric Generator Inventory (based on Form EIA-860M as a supplement to Form EIA-860), Inventory of Operating Generators as of September 2023 and Inventory of Planned Generators as of September 2023, Plant State: Rhode Island, Technology: Solar Photovoltaic.
38 Brown University, "Brown launches sustainability strategic plan to confront urgent environmental challenges," Press Release (March 5, 2021).
39 U.S. EIA, Electricity Data Browser, Net generation for all sectors (thousand megawatthours), Rhode Island, 2019-22.
40 U.S. EIA, Electricity, Preliminary Monthly Electric Generator Inventory (based on Form EIA-860M as a supplement to Form EIA-860), Inventory of Operating Generators as of September 2023, Plant State: Rhode Island, Technology: Landfill Gas, Other Waste Biomass.
41 U.S. EIA, Electricity Data Browser, Net generation for all sectors (thousand megawatthours), Rhode Island, 2018-21.
42 U.S. EIA, Electricity, Preliminary Monthly Electric Generator Inventory (based on Form EIA-860M as a supplement to Form EIA-860), Inventory of Operating Generators as of September 2023, Plant State: Rhode Island, Technology: Conventional Hydroelectric.
43 U.S. EIA, U.S. Energy Atlas, All Energy Infrastructure and Resources, Rhode Island, accessed October 4, 2023.
44 Orsted, Block Island Wind Farm, accessed October 4, 2023.
45 McKenna, Phil, "America's First Offshore Wind Energy Make Landfall in Rhode Island," Inside Climate News (May 1, 2017).
46 U.S. EIA, Electricity Data Browser, Net generation for all sectors (thousand megawatthours), Rhode Island, 2019-22.
47 U.S. EIA, Preliminary Monthly Electric Generator Inventory (based on Form EIA-860M as a supplement to Form EIA-860), Inventory of Operating Generators as of September 2023 and Inventory of Planned Generators as of September 2023, Plant State: Rhode Island, Technology: Onshore Wind Turbine.
48 Orsted, About Revolution Wind, accessed October 4, 2023.
49 DiSavino, Scott, "New England states join to buy offshore wind power as US industry struggles," Reuters (October 4, 2023).
50 NC Clean Energy Technology Center, DSIRE, Rhode Island, Renewable Energy Standard, updated November 10, 2022.
51 State of Rhode Island Governor Dan McKee, "Governor McKee Signs Historic Legislation Requiring 100% of Rhode Island's Electricity to be Offset by Renewable Energy by 2033," Press Release (June 29, 2022).
52 U.S. EIA, Crude Oil Proved Reserves, Reserves Changes, and Production, Estimated Production and Proved Reserves as of 12/31, 2016-21.
53 U.S. EIA, Number and Capacity of Petroleum Refineries, Total Number of Operable Refineries as of January 1, 2018-23.
54 U.S. EIA, Petroleum and Other Liquids, Company Level Imports, accessed October 6, 2023.
55 Rhode Island Division of Planning, Energy 2035, Rhode Island State Energy Plan (October 8, 2015), p. 14.
56 U.S. Department of Energy, State of Rhode Island Energy Sector Risk Profile, p. 4.
57 U.S. EIA, State Energy Data System, Table C15, Petroleum Consumption Estimates, Total and per Capita, Ranked by State, 2021.
58 U.S. EIA, State Energy Data System, Table F16, Total Petroleum Consumption Estimates, 2021.
59 U.S. EIA, State Energy Data System, Table C2, Energy Consumption Estimates for Selected Major Energy Sources in Physical Units, 2021.
60 Larson, B. K., U.S. Gasoline Requirements, ExxonMobil (January 2018).
61 U.S. EIA, State Energy Data System, Table F16, Total Petroleum Consumption Estimates, 2021.
62 U.S. Census Bureau, House Heating Fuel, Table B25040, 2022 ACS 1-Year Estimates Detailed Tables, Rhode Island.
63 U.S. Department of Energy, Office of Fossil Energy, Northeast Home Heating Oil Reserve, History, accessed October 6, 2023.
64 U.S. Department of Energy, Office of Fossil Energy, Northeast Home Heating Oil Reserve (NEHHOR), About HEHHOR, accessed October 6, 2023.
65 U.S. EIA, State Energy Data System, Table F16, Total Petroleum Consumption Estimates, 2021.
66 U.S. EIA, Natural Gas Reserves Summary as of Dec. 31, Dry Natural Gas, Annual, 2016-21.
67 U.S. EIA, Natural Gas Gross Withdrawals and Production, Gross Withdrawals, Annual, 2017-22.
68 Enbridge, Algonquin Gas Transmission, accessed October 6, 2023.
69 Kinder Morgan, Natural Gas Pipelines, Tennessee Gas Pipeline and Asset Map, accessed October 6, 2023.
70 State of Rhode Island Office of Energy Resources, Lean About Natural Gas, Where does natural gas used in Rhode Island come from?, accessed October 6, 2023.
71 U.S. EIA, "New England natural gas pipeline capacity increases for the first time since 2010," Today in Energy (December 6, 2016).
72 U.S. EIA, International and Interstate Movements of Natural Gas by State, Rhode Island, 2017-22.
73 U.S. EIA, Natural Gas Consumption by End Use, Rhode Island, Annual, 2017-22.
74 U.S. EIA, Electricity Data Browser, Net generation for all sectors (thousand megawatthours), Rhode Island, 2019-22.
75 U.S. EIA, Natural Gas Consumption by End Use, Rhode Island, Annual, 2017-22.
76 U.S. Census Bureau, House Heating Fuel, Table B25040, 2022 ACS 1-Year Estimates Detailed Tables, Rhode Island.
77 ISO-New England, Natural Gas Infrastructure Constraints, accessed October 6, 2023.
78 U.S. EIA, Underground Natural Gas Storage Capacity, Total Storage Capacity, Annual, 2017-22.
79 U.S. EIA, International and Interstate Movements of Natural Gas by State, Massachusetts, 2017-22.
80 U.S. EIA, International and Interstate Movements of Natural Gas by State, Rhode Island, 2017-22.
81 McGaw, Jim, "LNG to be stored at Portsmouth site for at least another 3-4 years," EastBayRI (October 16, 2020).
82 Lavin, Nancy, "Regulators approve temporary extension on Portsmouth LNG facility for upcoming winter," Rhode Island Current (October 2, 2023).
83 U.S. EIA, Annual Coal Report 2022 (October 3, 2023), Tables 1, 15.
84 U.S. EIA, Electric Power Monthly (February 2023), Table 1.4.B.
85 U.S. EIA, Quarterly Coal Report, October-December 2016-22, Previous reports, Table 20, Coal Imports by Customs District.
Other Resources
Energy-Related Regions and Organizations
- Petroleum Administration for Defense District (PADD): 1A
- Regional Transmission Organization (RTO) and Independent System Operator (ISO): ISO New England (ISO-NE)
- North American Electric Reliability Corporation (NERC) ERO Enterprise: Regional Entities: Northeast Power Coordinating Council (NPCC)
Other Websites
- Rhode Island Office of Energy Resources
- Rhode Island Department of Human Services, Low Income Home Energy Assistance Program (LIHEAP)
- Rhode Island Department of Human Services, Weatherization Assistance Program (WAP)
- Rhode Island Public Utilities Commission and Division of Public Utilities and Carriers
- State of Rhode Island, Energy Efficiency and Resource Management Council
- Rhode Island League of Cities and Towns, Rhode Island Energy Aggregation Program
- Rhode Island Commerce Corporation, Financing, Renewable Energy Fund
- Rhode Island Office of Energy Resources, Electric Vehicle Charging Stations
- Rhode Island Geological Survey
- EIA Rhode Island Flickr Album
- U.S. Department of the Interior, Bureau of Ocean Energy Management
- Alternative Fuels Data Center, Federal and State Laws and Incentives
- U.S. Department of Health and Human Services, Administration for Children and Families, Office of Community Services, Low Income Home Energy Assistance Program (LIHEAP)
- Benefits.Gov, Housing and Public Utilities
- NC Clean Energy Technology Center, Database of State Incentives for Renewables and Efficiency (DSIRE)
- National Association of Regulatory Utility Commissioners (NARUC)
- National Association of State Energy Officials (NASEO)
- National Conference of State Legislatures (NCSL), Research and Policy
- National Renewable Energy Laboratory (NREL), Geospatial Data Science Data and Tools
- U.S. Geological Survey (USGS), Publications
- U.S. Geological Survey, Maps
- Lawrence Livermore National Laboratory, Energy Flow Charts
- National Renewable Energy Laboratory, State and Local Planning for Energy (SLOPE)
- EIA New England Dashboard
- The Regional Greenhouse Gas Initiative
- EIA Natural Gas Storage Dashboard
- EIA Energy Disruptions
- U.S. Department of Agriculture (USDA), Rural Development, Energy Programs
- Rhode Island Department of Environmental Management, RI Agricultural Energy Program
- Rhode Island Office of Energy Resources, Renewable Energy Growth Program