New Hampshire Quick Facts
- About three-fifths (59%) of New Hampshire households use petroleum products as their primary heating fuel, the second-largest share among the states and almost seven times greater than the national average.
- Seabrook, one of only two nuclear power plants in New England and the largest power plant in New Hampshire, provided 58% of New Hampshire’s 2022 total in-state electricity net generation.
- In 2022, 14% of New Hampshire's electricity generation came from renewable resources, including small-scale solar installations. Most of the state's renewable generation comes from biomass. hydroelectric power, and wind.
- New Hampshire has the two remaining coal-fired power plants in New England—Schiller at Portsmouth and Merrimack at Bow. Coal-fired plants no longer supply baseload power, but they play an important role in providing electricity on high demand days.
- New Hampshire's residential sector accounted for about one-third of state energy consumption in 2021, even though about 1 in 10 New Hampshire homes are only seasonally or occasionally occupied.
Last Updated: October 19, 2023
Data
Last Update: April 18, 2024 | Next Update: May 16, 2024
| Prices | |||||
|---|---|---|---|---|---|
| Petroleum | New Hampshire | U.S. Average | Period | find more | |
| Domestic Crude Oil First Purchase | -- | $ 72.26 /barrel | Jan-24 | ||
| Natural Gas | New Hampshire | U.S. Average | Period | find more | |
| City Gate | $ 4.10 /thousand cu ft | $ 4.76 /thousand cu ft | Jan-24 | find more | |
| Residential | $ 18.83 /thousand cu ft | $ 11.82 /thousand cu ft | Jan-24 | find more | |
| Coal | New Hampshire | U.S. Average | Period | find more | |
| Average Sales Price | -- | $ 54.46 /short ton | 2022 | ||
| Delivered to Electric Power Sector | -- | $ 2.48 /million Btu | Jan-24 | ||
| Electricity | New Hampshire | U.S. Average | Period | find more | |
| Residential | 25.07 cents/kWh | 15.45 cents/kWh | Jan-24 | find more | |
| Commercial | 20.30 cents/kWh | 12.68 cents/kWh | Jan-24 | find more | |
| Industrial | 17.23 cents/kWh | 8.10 cents/kWh | Jan-24 | find more | |
| Reserves | |||||
|---|---|---|---|---|---|
| Reserves | New Hampshire | Share of U.S. | Period | find more | |
| Crude Oil (as of Dec. 31) | -- | -- | 2021 | find more | |
| Expected Future Production of Dry Natural Gas (as of Dec. 31) | -- | -- | 2021 | find more | |
| Expected Future Production of Natural Gas Plant Liquids | -- | -- | 2021 | find more | |
| Recoverable Coal at Producing Mines | -- | -- | 2022 | find more | |
| Rotary Rigs & Wells | New Hampshire | Share of U.S. | Period | find more | |
| Natural Gas Producing Wells | -- | -- | 2020 | find more | |
| Capacity | New Hampshire | Share of U.S. | Period | ||
| Crude Oil Refinery Capacity (as of Jan. 1) | -- | -- | 2023 | ||
| Electric Power Industry Net Summer Capacity | 4,467 MW | 0.4% | Jan-24 | ||
| Supply & Distribution | |||||
|---|---|---|---|---|---|
| Production | New Hampshire | Share of U.S. | Period | find more | |
| Total Energy | 148 trillion Btu | 0.2% | 2021 | find more | |
| Crude Oil | -- | -- | Jan-24 | find more | |
| Natural Gas - Marketed | -- | -- | 2022 | find more | |
| Coal | -- | -- | 2022 | find more | |
| Total Utility-Scale Net Electricity Generation | New Hampshire | Share of U.S. | Period | find more | |
| Total Net Electricity Generation | 1,595 thousand MWh | 0.4% | Jan-24 | ||
| Utility-Scale Net Electricity Generation (share of total) | New Hampshire | U.S. Average | Period | ||
| Petroleum-Fired | NM | 0.4 % | Jan-24 | find more | |
| Natural Gas-Fired | 22.8 % | 42.2 % | Jan-24 | find more | |
| Coal-Fired | 1.8 % | 19.9 % | Jan-24 | find more | |
| Nuclear | 58.2 % | 18.2 % | Jan-24 | find more | |
| Renewables | 16.9 % | 18.8 % | Jan-24 | ||
| Stocks | New Hampshire | Share of U.S. | Period | find more | |
| Motor Gasoline (Excludes Pipelines) | -- | -- | Jan-24 | ||
| Distillate Fuel Oil (Excludes Pipelines) | 528 thousand barrels | 0.5% | Jan-24 | find more | |
| Natural Gas in Underground Storage | -- | -- | Jan-24 | find more | |
| Petroleum Stocks at Electric Power Producers | 282 thousand barrels | 1.3% | Jan-24 | find more | |
| Coal Stocks at Electric Power Producers | W | W | Jan-24 | find more | |
| Fueling Stations | New Hampshire | Share of U.S. | Period | ||
| Motor Gasoline | 570 stations | 0.5% | 2021 | ||
| Propane | 13 stations | 0.5% | Mar-24 | ||
| Electric Vehicle Charging Locations | 233 stations | 0.4% | Mar-24 | ||
| E85 | 0 stations | 0.0% | Mar-24 | ||
| Biodiesel, Compressed Natural Gas, and Other Alternative Fuels | 3 stations | 0.1% | Mar-24 | ||
| Consumption & Expenditures | |||||
|---|---|---|---|---|---|
| Summary | New Hampshire | U.S. Rank | Period | ||
| Total Consumption | 302 trillion Btu | 46 | 2021 | find more | |
| Total Consumption per Capita | 217 million Btu | 40 | 2021 | find more | |
| Total Expenditures | $ 5,660 million | 44 | 2021 | find more | |
| Total Expenditures per Capita | $ 4,080 | 22 | 2021 | find more | |
| by End-Use Sector | New Hampshire | Share of U.S. | Period | ||
| Consumption | |||||
| » Residential | 97 trillion Btu | 0.5% | 2021 | find more | |
| » Commercial | 67 trillion Btu | 0.4% | 2021 | find more | |
| » Industrial | 39 trillion Btu | 0.1% | 2021 | find more | |
| » Transportation | 99 trillion Btu | 0.4% | 2021 | find more | |
| Expenditures | |||||
| » Residential | $ 1,780 million | 0.6% | 2021 | find more | |
| » Commercial | $ 1,032 million | 0.5% | 2021 | find more | |
| » Industrial | $ 497 million | 0.2% | 2021 | find more | |
| » Transportation | $ 2,351 million | 0.4% | 2021 | find more | |
| by Source | New Hampshire | Share of U.S. | Period | ||
| Consumption | |||||
| » Petroleum | 29 million barrels | 0.4% | 2021 | find more | |
| » Natural Gas | 58 billion cu ft | 0.2% | 2022 | find more | |
| » Coal | 147 thousand short tons | * | 2022 | find more | |
| Expenditures | |||||
| » Petroleum | $ 3,402 million | 0.4% | 2021 | find more | |
| » Natural Gas | $ 718 million | 0.3% | 2022 | find more | |
| » Coal | $ 18 million | 0.1% | 2022 | find more | |
| Consumption for Electricity Generation | New Hampshire | Share of U.S. | Period | find more | |
| Petroleum | 2 thousand barrels | 0.1% | Jan-24 | find more | |
| Natural Gas | 2,598 million cu ft | 0.2% | Jan-24 | find more | |
| Coal | 12 thousand tons | * | Jan-24 | find more | |
| Energy Source Used for Home Heating (share of households) | New Hampshire | U.S. Average | Period | ||
| Natural Gas | 21.8 % | 46.2 % | 2022 | ||
| Fuel Oil | 40.1 % | 3.9 % | 2022 | ||
| Electricity | 11.0 % | 41.3 % | 2022 | ||
| Propane | 18.7 % | 5.0 % | 2022 | ||
| Other/None | 8.4 % | 3.5 % | 2022 | ||
| Environment | |||||
|---|---|---|---|---|---|
| Renewable Energy Capacity | New Hampshire | Share of U.S. | Period | find more | |
| Total Renewable Energy Electricity Net Summer Capacity | 947 MW | 0.3% | Jan-24 | ||
| Ethanol Plant Nameplate Capacity | -- | -- | 2023 | ||
| Renewable Energy Production | New Hampshire | Share of U.S. | Period | find more | |
| Utility-Scale Hydroelectric Net Electricity Generation | 153 thousand MWh | 0.7% | Jan-24 | ||
| Utility-Scale Solar, Wind, and Geothermal Net Electricity Generation | 43 thousand MWh | 0.1% | Jan-24 | ||
| Utility-Scale Biomass Net Electricity Generation | 73 thousand MWh | 1.8% | Jan-24 | ||
| Small-Scale Solar Photovoltaic Generation | 20 thousand MWh | 0.4% | Jan-24 | ||
| Fuel Ethanol Production | 0 thousand barrels | 0.0% | 2021 | ||
| Renewable Energy Consumption | New Hampshire | U.S. Rank | Period | find more | |
| Renewable Energy Consumption as a Share of State Total | 16.7 % | 17 | 2021 | ||
| Fuel Ethanol Consumption | 1,681 thousand barrels | 40 | 2021 | ||
| Total Emissions | New Hampshire | Share of U.S. | Period | find more | |
| Carbon Dioxide | 13.3 million metric tons | 0.3% | 2021 | ||
| Electric Power Industry Emissions | New Hampshire | Share of U.S. | Period | find more | |
| Carbon Dioxide | 2,543 thousand metric tons | 0.2% | 2022 | ||
| Sulfur Dioxide | 1 thousand metric tons | 0.1% | 2022 | ||
| Nitrogen Oxide | 2 thousand metric tons | 0.2% | 2022 | ||
Analysis
Last Updated: October 19, 2023
Overview
About 1 in 18 New Hampshire households use wood as their main heating source.
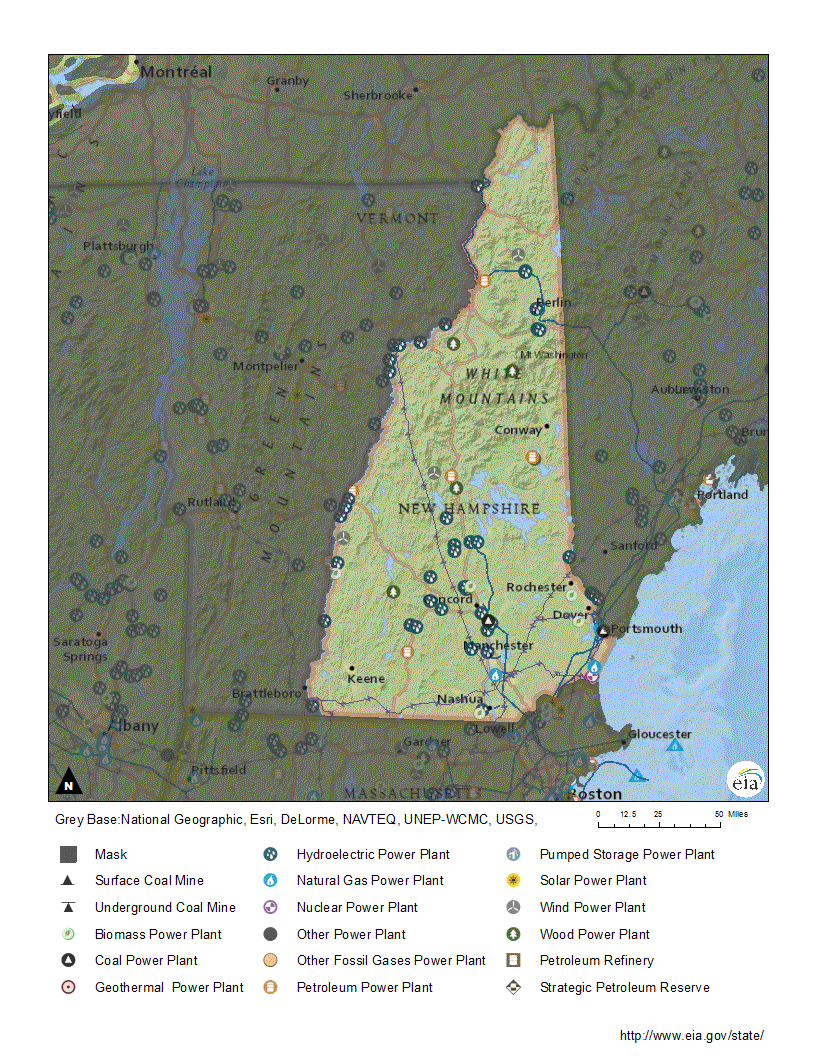
New Hampshire is nestled in northern New England between Vermont, Massachusetts, and Maine. It is one of the smallest states in the nation, but its terrain ranges from ocean beaches to rugged mountains, including Mount Washington, the highest peak in the northeast. Maine and the Atlantic Ocean form New Hampshire's eastern borders, but the state's Atlantic coastline is only about 20 miles in length. That coastline contains both recreational beaches and Portsmouth, a deep-draft, ice-free port, where the Portsmouth Naval Shipyard repairs the U.S. nuclear submarine fleet.1,2,3 Although it has no fossil energy resources, New Hampshire's mountains, rivers, and forests hold plentiful renewable energy resources.4 Several large rivers run through the state, and some of the dams on those rivers have provided New Hampshire with hydroelectric power for more than a century.5 The White Mountains of northern New Hampshire, home to record surface wind speeds, became the site of the nation's first attempt to produce electricity from wind resources at a commercial wind farm in 1980.6,7 Forests that cover more than four-fifths of New Hampshire make the state second only to Maine in the percentage of its area that is woodland, and wood is the mainstay of New Hampshire's biomass energy industry.8 It is used both for power generation and for space heating.9 About 1 in 18 New Hampshire households use wood as their primary heating source, four times the national average.10 Most of New Hampshire's small population lives in the southeastern part of the state.11 However, the state's natural beauty and proximity to northeastern population centers draw many visitors and part-time residents.12,13
New Hampshire's transportation and residential sectors account for nearly equal shares of state total energy consumption at almost one-third each. In 2021, the residential sector used slightly less energy than the transportation sector, in part because about 1 in 10 New Hampshire homes are only seasonally or occasionally occupied.14 The commercial sector accounted for more than one-fifth of state energy consumption and the industrial sector used only slightly more than one-eighth.15 Private service-providing industries, including real estate, finance, and insurance, are the largest contributors to New Hampshire's gross domestic product (GDP), and less energy-intensive computer and electronics manufacturing has replaced New Hampshire's long-established textile and shoe manufacturing industries.16,17 As a result, New Hampshire is among the 10 states that use the smallest amount of energy for every dollar of GDP created.18 Even so, New Hampshire uses more than twice as much energy as it produces.19
Electricity
In 2022, New Hampshire’s largest power plant and only nuclear facility accounted for almost three-fifths of the state’s electricity net generation.
In 2022, almost three-fifths of New Hampshire's total in-state net electricity generation came from the state's only nuclear generating station, which is New Hampshire's largest power plant.20 Two natural gas-fired plants are the next largest power plants by both capacity and generation.21 In 2022, natural gas provided nearly one-fourth of the state's total electricity generation. Biomass (primarily from wood and wood-derived fuels), hydroelectric power, and wind supplied most of the rest of the state's total generation. Petroleum, coal, and solar energy also fueled small amounts of generation. Petroleum, which is used primarily to generate power when demand is highest, has fueled less than 2.5% of the state's power generation since 2006. Coal's contribution declined from 25% of New Hampshire's total in-state generation in 2001 to less than 2% in 2022. At the same time, the contribution from natural gas increased from less than 1% in 2001 to 24% in 2022.22 Because New Hampshire's power plants generate more electricity than the state consumes, the state sends its excess generation to other states and to Canada.23
New Hampshire had lower total electricity retail sales per capita than all but six other states in 2021.24 Only one in nine New Hampshire households use electricity as their primary heating source, but with fewer winter daylight hours than in many other states, the residential sector accounted for about 44% of the state's electricity use in 2022.25 The commercial sector consumed about 38%, and the industrial sector used the rest.26 New Hampshire is a participant in the Regional Greenhouse Gas Initiative (RGGI), a multi-state cap and trade program that sets regional caps aimed at reducing carbon dioxide emissions from power generation. Carbon dioxide emissions in New Hampshire are among the lowest in the nation, less than in all but three other states.27 New Hampshire has used most of its RGGI emission allowance auction proceeds to reduce energy use and lower electricity bills through rebates.28 In 2022, the state had the fourth-highest average electricity price in the nation.29
Renewable energy
In 2022, renewable energy supplied 14% of New Hampshire’s total in-state electricity. generation.
In 2022, renewable resources provided about 14% of New Hampshire's total in-state electricity generation, mostly from biomass and hydroelectric power.30 Biomass supplied the largest share of New Hampshire's electricity generation from renewable resources in 2022 and accounted for more than 5% of the state's total net generation. Wood and wood-derived fuels from the state's forest products industry provided about 86% of the state's biomass-fueled generation.31 The rest came from landfill gas and municipal solid waste.32 New Hampshire's biomass resources also provide the feedstock for the state's one wood pellet manufacturing plant. It can produce about 79,000 tons of wood pellets each year. Wood pellets are burned for heating and electricity generation.33 The state also has a small biofuels industry. New Hampshire has one biodiesel plant with a capacity of about 8 million gallons per year.34 In 2021, New Hampshire consumed about 3 million gallons of biodiesel.35 The state does not have any fuel ethanol production plants, but New Hampshire consumed about 71 million gallons of fuel ethanol in 2021.36,37
Hydroelectric power was the second-largest source of New Hampshire's renewable generation in 2022. The state is home to one-fourth of New England's hydroelectric generating capacity. New Hampshire accounted for almost 16% of the region's hydroelectric net generation in 2022, when it supplied nearly 5% of New Hampshire's total net generation.38,39 The state has 33 utility-scale (1 megawatt or larger) hydroelectric facilities. The two largest hydroelectric power plants in New England—the 189-megawatt S.C. Moore and the 166-megawatt Comerford hydropower dams—are located on the Connecticut River along New Hampshire's border with Vermont. However, most of the state's utility-scale hydroelectric facilities have capacities of less than 5 megawatts.40
Wind and solar energy facilities supply the rest of New Hampshire's renewable electricity generation. In 2022, wind energy accounted for almost 3% of New Hampshire's total in-state electricity generation.41 Areas along the state's short Atlantic coastline and on its mountain ridges have New Hampshire's best wind resources.42 The state's first modern wind farm came online in 2008, and as of August 2023, New Hampshire has 5 utility-scale wind farms with a combined 212 megawatts of capacity.43 All of the state's wind turbines are located on mountain ridges in northern and western New Hampshire.44 In 2016, wind supplied more of the state's net generation than coal for the first time, and, with the exception of 2018, annual generation from wind has continued to exceed that of coal.45
New Hampshire has modest solar energy resources.46 Solar energy supplied about 1% of New Hampshire's total net generation in 2022, almost all of it from small-scale (less than 1 megawatt) installations.47 The state's first and so far only utility-scale solar-powered facility came online in early 2019 with a capacity of 2.4 megawatts.48 Prior to that, the state's largest solar facility was an almost utility-scale 944-kilowatt photovoltaic (PV) solar array at a wastewater treatment plant in the town of Peterborough.49 The rest of New Hampshire's solar power generation comes from small-scale, customer-sited installations, mostly rooftop solar panels but also larger ground-mounted arrays.50 In mid-2023, the total capacity of New Hampshire's solar installations was about 213 megawatts. Almost 211 megawatts of that was at small-scale solar facilities.51
New Hampshire's renewable portfolio standard (RPS) requires that by 2025 the state's electricity providers, except for municipal utilities, acquire the equivalent of 25.2% of the electricity they sell from renewable energy sources or by purchasing renewable energy credits. State power suppliers can use electricity generated from renewable energy resources in neighboring New England states to comply with the RPS. New Hampshire's RPS includes credit for new thermal energy projects that deliver energy as heat instead of as electricity, such as solar thermal, geothermal, and ocean thermal facilities.52 The state requires utilities that sell electricity in New Hampshire to offer net metering to customer-sited electricity generators that use eligible renewable or combined-heat-and-power technologies up to an aggregate total of 100 megawatts.53
Petroleum
New Hampshire does not produce or refine crude oil and has no crude oil reserves.54 Although petroleum products account for about half of the state's total energy consumption, there are no petroleum product pipelines in New Hampshire.55,56,57 All refined petroleum products arrive in the state by rail, truck, or ship. Some arrive at Portsmouth, the state's only seaport. Most of the petroleum products are from Mid-Atlantic and Gulf of Mexico refineries or from other countries.58 Although most of the state's imported petroleum products are from Canada, refined products also arrive from several other countries. Distillate and propane are the most common imports.59 There are marine terminal and storage facilities at Portsmouth for heating oil, propane, and other petroleum products.60,61 The terminals connect with rail lines and highways that take petroleum products inland. Distributors also bring in supplies by rail and by truck from neighboring states.62 One crude oil pipeline crosses through New Hampshire's northeastern White Mountains, but does not deliver crude oil in New Hampshire. Built in 1941, it is the only crude oil pipeline in the state and it operates intermittently. It transports crude oil from tanker docks at Portland, Maine, to refineries in Montreal, Canada.63,64
Two-fifths of New Hampshire households use fuel oil for heating, about 10 times the national average.
New Hampshire uses less petroleum than all but five other states, but per capita use in New Hampshire is greater than in more than half the states.65 Although New Hampshire is a small state with fewer road miles traveled than most other states, the transportation sector accounts for about two-thirds of state petroleum consumption.66,67 The more densely populated counties in southeastern New Hampshire require the use and sale of reformulated motor gasoline blended with ethanol. However, most gasoline sold in New Hampshire and the nation contains at least 10% ethanol.68,69 New Hampshire's residential sector, where about three-fifths of households use petroleum products as the primary source for space heating, accounts for one-fifth of state petroleum use.70,71 Only one other state, Maine, heats a larger share of its households with petroleum products. Two-fifths of New Hampshire's households use fuel oil as their primary heating fuel, ten times the national average, and almost one in five homes use hydrocarbon gas liquids (HGLs), mostly propane, for heat, nearly four times the national average.72 The commercial sector accounts for almost one-tenth of state petroleum use and the industrial sector uses almost all the rest. The electric power sector uses a very small amount of petroleum, primarily as a backup fuel.73
New Hampshire is particularly vulnerable to distillate fuel oil supply constraints and price spikes during the winter months. In a supply emergency, the U.S. Department of Energy can release heating oil from the Northeast Home Heating Oil Reserve (NEHHOR), created by Congress in 2000, to avert supply disruptions. In 2011, the Reserve replaced its stockpile of high-sulfur heating oil with ultra-low sulfur heating oil (ULSHO). By 2018, ULSHO had replaced high-sulfur heating oil use throughout New England, including in New Hampshire.74 The NEHHOR holds a total of 1 million barrels of ULSHO, with 400,000 of those barrels stored nearby in Massachusetts.75
Natural gas
New Hampshire does not have any natural gas reserves or production.76,77 Natural gas enters New Hampshire by interstate pipelines, primarily from Canada and from domestic production through the surrounding New England states. In 2021, about three-fourths of the natural gas that entered New Hampshire left the state.78 The electric power sector is the largest natural gas consumer in New Hampshire, accounting for more than half of the natural gas used in the state.79 However, as power companies use more natural gas to fuel electricity generation in New Hampshire, and in New England as a whole, assurance of natural gas supply has become a critical energy issue for the region.80,81 The industrial and commercial sectors almost evenly split about one-third of the natural gas delivered to consumers. The residential sector, where about one in five homes are heated with natural gas, used almost all the rest. A very small amount is used as transportation fuel.82,83 In 2021, New Hampshire consumed less natural gas than all but three other states. Most of the state does not have any natural gas distribution infrastructure.84,85
Coal
New Hampshire has the only two coal-fired electricity generating stations in New England.
There are no coal reserves or coal mines in New Hampshire, but the state does have the only two coal-fired electricity generating stations in New England—Schiller at Portsmouth and Merrimack at Bow.86,87 The Schiller station has generating units that can burn either coal or petroleum products, and one unit that can burn woody biomass.88 However, the Schiller plant is out of service and is not expected to come back online within the next calendar year.89 The much larger Merrimack coal-fired power plant operates intermittently.90 Coal-fired plants no longer supply baseload power, but they play an important role in providing electricity on high demand days, especially in winter when supplies of natural gas for electricity generation are constrained by increased natural gas use for space heating. New Hampshire's electric power sector received only a small amount of coal in 2021. It came from West Virginia.91
Endnotes
1 NETSTATE, New Hampshire Geography, updated February 25, 2016.
2 World Port Source, Port of Portsmouth, Review and History, and Port Commerce, accessed September 22, 2023.
3 Naval Sea Systems Command, Portsmouth Naval, About Us, accessed September 22, 2023.
4 U.S. Energy Information Administration (EIA), New Hampshire Profile Data, Reserves and Environment, accessed September 22, 2023.
5 U.S. EIA, Electricity, Form EIA-860 detailed data with previous form data (EIA-860A/860B), 2022 Form EIA-860 Data, Schedule 3, 'Generator Data' (Operable Units Only).
6 Mount Washington Observatory, World Record Wind, accessed September 23, 2023.
7 Brooks, David, "Remembering the World's First Wind Farm-in New Hampshire," Granite Geek (February 24, 2016).
8 New Hampshire Division of Forests and Lands, New Hampshire Forest Statistics, accessed September 23, 2023.
9 U.S. EIA, Electricity, Form EIA-860 detailed data with previous form data (EIA-860A/860B), 2022 Form EIA-860 Data, Schedule 3, 'Generator Data' (Operable Units Only).
10 U.S. Census Bureau, New Hampshire, Table B25040, House Heating Fuel, 2022 American Community Survey 1-Year Estimates.
11 U.S. Census Bureau, 2010 Census: New Hampshire Profile, accessed September 23, 2023.
12 Kitch, Michael, "The economic impact of second homes in New Hampshire," New Hampshire Business Review (July 20, 2017).
13 New Hampshire Governor Chris Sununu, "New Hampshire Tourism Reports Record Breaking Fall Season," Press Release (May 18, 2022).
14 U.S. Census Bureau, New Hampshire, 2022, Tables B25002, Occupancy Status, and B25004, Vacancy Status.
15 U.S. EIA, State Energy Data System, Table F35, Total Energy Consumption, Price, and Expenditure Estimates, 2021.
16 U.S. Bureau of Economic Analysis, Interactive Data, Regional Data, GDP and Personal Data, Annual Gross Domestic Product (GDP) by State, GDP in current dollars, New Hampshire, All statistics in table, 2021-22.
17 Bookman, Todd, "Made in New Hampshire: Manufacturing's Rise and Fall in Manchester," New Hampshire Public Radio (March 27, 2017).
18 U.S. EIA, State Energy Data System, Table C10, Total Energy Consumption Estimates, Gross Domestic Product (GDP), Energy Consumption Estimates per Real Dollar of GDP, Ranked by State, 2021.
19 U.S. EIA, State Energy Data System, Table P3, Total Primary Energy Production and Total Energy Consumption Estimates in Trillion Btu, 2021.
20 U.S. Nuclear Regulatory Commission, New Hampshire, updated June 17, 2022.
21 U.S. EIA, New Hampshire Electricity Profile 2021, Tables 2A, 2B.
22 U.S. EIA, Electricity Data Browser, Net generation for all sectors, New Hampshire, Fuel Type (Check all), Annual, 2001‒22.
23 U.S. EIA, State Electricity Profiles, New Hampshire Electricity Profile 2021, Table 10, Supply and disposition of electricity, 1990 through 2021.
24 U.S. EIA, State Energy Data System, Table C17, Electricity Sales to Ultimate Customers, Total and Residential, Total and per Capita, Ranked by State, 2021.
25 U.S. Census Bureau, New Hampshire, Table B25040, House Heating Fuel, 2022 American Community Survey 1-Year Estimates.
26 U.S. EIA, Electricity Data Browser, Retail sales of Electricity, New Hampshire, All sectors, Residential, Commercial, Industrial, Annual 2022.
27 U.S. EIA, Rankings: Total Carbon Dioxide Emissions, 2021.
28 Regional Greenhouse Gas Initiative, The Investment of RGGI Proceeds in 2021 (June 2023), p. 4, 31-33.
29 U.S. EIA, Electric Power Monthly (February 2023), Table 5.6.B.
30 U.S. EIA, Electricity Data Browser, Net generation from all sectors, New Hampshire, All fuels, Conventional hydroelectric, Other renewables, Wind, Biomass, All solar, Small-scale solar photovoltaic, Annual, 2022.
31 U.S. EIA, Electricity Data Browser, Net generation from all sectors, New Hampshire, Conventional hydroelectric, Other renewables (total), Wind, Biomass (total), Wood and wood-derived fuels, All solar, Small-scale solar photovoltaic, Annual, 2022.
32 U.S. EIA, Electricity, Preliminary Monthly Electric Generator Inventory (based on Form EIA-860M as a supplement to Form EIA-860), Inventory of Operating Generators as of August 2023.
33 U.S. EIA, Monthly Densified Biomass Fuel Report, Table 1, Densified biomass fuel manufacturing facilities in the United States by state, region, and capacity, June 2023.
34 U.S. EIA, U.S. Biodiesel Plant Production Capacity, U.S. Biodiesel Plant Production Capacity as of January 1, 2023.
35 U.S. EIA, State Energy Data System, Table F26, Biodiesel Consumption Estimates, 2021.
36 U.S. EIA, U.S. Fuel Ethanol Plant Production Capacity, U.S. fuel ethanol plant count by state, 2023.
37 U.S. EIA, State Energy Data System, Table F25, Fuel Ethanol Consumption Estimates, 2021.
38 U.S. EIA, Electric Power Monthly (August 2022), Table 6.2.B.
39 U.S. EIA, Electricity Data Browser, Net generation from all sectors, New England, New Hampshire, All fuels, Conventional hydroelectric, Small-scale solar photovoltaic, Annual, 2022.
40 U.S. EIA, Electricity, Preliminary Monthly Electric Generator Inventory (based on Form EIA-860M as a supplement to Form EIA-860), Inventory of Operating Generators as of August 2023.
41 U.S. EIA, Electricity Data Browser, Net generation for all sectors, New Hampshire, All fuels, Wind, Small-scale solar photovoltaic, Annual, 2022.
42 U.S. Department of Energy, Energy Efficiency and Renewable Energy, WINDExchange, Wind Energy in New Hampshire, and U.S. Offshore 90-Meter Wind Resource Potential, accessed September 25, 2023.
43 U.S. EIA, Electricity, Preliminary Monthly Electric Generator Inventory (based on Form EIA-860M as a supplement to Form EIA-860), Inventory of Operating Generators as of August 2023.
44 U.S. EIA, New Hampshire Profile Overview, Interactive GIS Data Viewer, Wind Power Plant Map Layer, accessed September 25, 2023.
45 U.S. EIA, Electricity Data Browser, Net generation for all sectors, New Hampshire, Coal, Wind, Annual, 2001‒22.
46 Roberts, Billy J., Direct Normal Solar Irradiance, National Renewable Energy Laboratory (February 22, 2018).
47 U.S. EIA, Electricity Data Browser, Net generation for all sectors, New Hampshire, All fuels, All solar, Small-scale solar photovoltaic, All utility-scale solar, Annual, 2001‒22.
48 U.S. EIA, Electricity, Preliminary Monthly Electric Generator Inventory (based on Form EIA-860M as a supplement to Form EIA-860), Inventory of Operating Generators as of August 2023.
49 Town of Peterborough, Infrastructure Projects in the Town of Peterborough, Sustainability, Solar Powered WWTP, accessed September 25, 2023.
50 Star Island, Isle of Shoals, NH, The Island, The Green Gosport Initiative, accessed September 25, 2023.
51 U.S. EIA, Electric Power Monthly (August 2022), Table 6.2.B.
52 NC Clean Energy Technology Center, DSIRE, New Hampshire, Renewable Portfolio Standard, updated July 20, 2023.
53 NC Clean Energy Technology Center, DSIRE, Net Metering, New Hampshire, updated February 14, 2023.
54 U.S. EIA, New Hampshire, Profile Data, Supply & Distribution and Reserves, accessed September 26, 2023.
55 U.S. EIA, State Energy Data System, Table F33, Total Energy Consumption, Price, and Expenditure Estimates, 2021.
56 U.S. EIA, State Energy Data System, Table F16, Total Petroleum Consumption Estimates, 2021.
57 U.S. EIA, New Hampshire Profile Overview, Interactive GIS Data Viewer, Petroleum Product Pipeline and HGL Pipeline Map Layers, accessed September 26, 2023.
58 New Hampshire Department of Transportation, Statewide Freight Plan, Final Report (January 2019), p. 17, 110, 125.
59 U.S. EIA, Petroleum and Other Liquids, Company Level Imports, accessed September 26, 2023.
60 U.S. EIA, New Hampshire Profile Overview, Interactive GIS Data Viewer, Petroleum Product Terminal Map Layer, accessed September 26, 2023.
61 Magnusson, Matthew, Charles Colgan, and Ross Gittell, The Economic Impact of the Piscataqua River and the Ports of Portsmouth and Newington (June 2012), p. 6.
62 New Hampshire Department of Transportation, Statewide Freight Plan, Final Report (January 2019), p. 100, 111.
63 U.S. EIA, New Hampshire Profile Overview, Interactive GIS Data Viewer, Crude Oil Pipeline and Petroleum Refinery Map Layers, accessed September 26, 2023.
64 Canada Energy Regulator, Pipeline Profiles: Montreal and Throughput and capacity, accessed September 26, 2023.
65 U.S. EIA, State Energy Data System, Table C15, Petroleum Consumption Estimates, Total and per Capita, Ranked by State, 2021.
66 U.S. EIA, State Energy Data System, Table F16, Total Petroleum Consumption Estimates, 2021.
67 Federal Highway Administration, Policy and Governmental Affairs, Office of Highway Policy Information, Highway Statistics 2021, HM-44 National Highway System Travel - 2021, Annual Vehicle Miles By Functional System, February 28, 2023.
68 U.S. Environmental Protection Agency, Gasoline Standards, Programs, Reformulated Gasoline, accessed September 26, 2023.
69 U.S. EIA, "Almost all U.S. gasoline is blended with 10% ethanol," Today in Energy (May 4, 2016).
70 U.S. Census Bureau, New Hampshire, Table B25040, House Heating Fuel, 2022 American Community Survey 1-Year Estimates.
71 U.S. EIA, State Energy Data System, Table F16, Total Petroleum Consumption Estimates, 2021.
72 U.S. Census Bureau, All states, United States, Table B25040, House Heating Fuel, 2022 American Community Survey 1-Year Estimates.
73 U.S. EIA, State Energy Data System, Table F16, Total Petroleum Consumption Estimates, 2021.
74 New England Fuel Institute, Guidance, Exemptions and Enforcement Discretion for New England's ULSHO Transition, accessed September 26, 2023.
75 U.S. Department of Energy, Office of Fossil Energy, Northeast Home Heating Oil Reserve, and NEHHOR History, accessed September 26, 2023.
76 U.S. EIA, Natural Gas Reserves Summary as of Dec. 31, Dry Natural Gas, Annual, 2016‒21.
77 U.S. EIA, Natural Gas Gross Withdrawals and Production, Gross Withdrawals, Annual, 2017-22.
78 U.S. EIA, International and Interstate Movements of Natural Gas by State, New Hampshire, 2016-21.
79 U.S. EIA, Natural Gas Consumption by End Use, New Hampshire, Annual 2017-22.
80 ISO New England, Resource Mix, accessed September 23, 2023.
81 ISO New England, Natural Gas Infrastructure Constraints, accessed September 23, 2023.
82 U.S. EIA, Natural Gas Consumption by End Use, New Hampshire, Annual 2017-22.
83 U.S. Census Bureau, New Hampshire, Table B25040, House Heating Fuel, 2022 American Community Survey 1-Year Estimates.
84 U.S. EIA, Natural Gas Consumption by End Use, Volumes Delivered to Consumers, Annual, 2017-22.
85 New Hampshire Public Service Commission, State of New Hampshire Gas Utilities Franchise Areas (April 25, 2019).
86 U.S. EIA, Annual Coal Report 2021 (October 2022), Tables 1, 15.
87 U.S. EIA, Electricity, Preliminary Monthly Electric Generator Inventory (based on Form EIA-860M as a supplement to Form EIA-860), Inventory of Operating Generators as of August 2023.
88 Power Technology, Wood Chip Burning Plant, Schiller Station, Portsmouth, New Hampshire, accessed September 26, 2023.
89 U.S. EIA, Electricity, Preliminary Monthly Electric Generator Inventory (based on Form EIA-860M as a supplement to Form EIA-860), Inventory of Operating Generators as of August 2023.
90 Brooks, David, "Merrimack Station power plant almost never runs these days, but not because of protests," Concord Monitor (September 26, 2019).
91 U.S. EIA, Annual Coal Distribution Report 2021 (October 2022), Domestic Coal Distribution, by Destination State, 2021, New Hampshire, Table DS-25.
Other Resources
Energy-Related Regions and Organizations
- Petroleum Administration for Defense District (PADD): 1A
- Regional Transmission Organization (RTO) and Independent System Operator (ISO): ISO New England (ISO-NE)
- North American Electric Reliability Corporation (NERC) ERO Enterprise: Regional Entities: Northeast Power Coordinating Council (NPCC)
Other Websites
- New Hampshire Office of Strategic Initiatives
- New Hampshire Public Utilities Commission
- New Hampshire Department of Energy, Fuel Assistance Program
- New Hampshire Department of Energy, Weatherization Assistance Program
- New Hampshire Public Utilities Commission, Energy Efficiency and Sustainable Energy Board
- New Hampshire Department of Energy, Energy Information
- New Hampshire Department of Energy, Energy Efficiency Programs and Services
- New Hampshire Department of Energy, Renewable Energy
- EIA New Hampshire Flickr Album
- U.S. Nuclear Regulatory Commission, New Hampshire
- Alternative Fuels Data Center, Federal and State Laws and Incentives
- Benefits.Gov, Housing and Public Utilities
- NC Clean Energy Technology Center, Database of State Incentives for Renewables and Efficiency (DSIRE)
- National Association of Regulatory Utility Commissioners (NARUC)
- National Association of State Energy Officials (NASEO)
- National Conference of State Legislatures (NCSL), Research and Policy
- National Renewable Energy Laboratory (NREL), Geospatial Data Science Data and Tools
- U.S. Geological Survey (USGS), Publications
- U.S. Department of the Interior, Bureau of Ocean Energy Management
- U.S. Department of Health and Human Services, Administration for Children and Families, Office of Community Services, Low Income Home Energy Assistance Program (LIHEAP)
- U.S. Geological Survey, Maps
- Lawrence Livermore National Laboratory, Energy Flow Charts
- National Renewable Energy Laboratory, State and Local Planning for Energy (SLOPE)
- EIA Status of U.S. Nuclear Outages
- EIA New England Dashboard
- EIA Natural Gas Storage Dashboard
- The Regional Greenhouse Gas Initiative
- EIA Energy Disruptions
- U.S. Department of Agriculture (USDA), Rural Development, Energy Programs