|
Download Data (XLS File) |
|
||||||||
|
||||||||
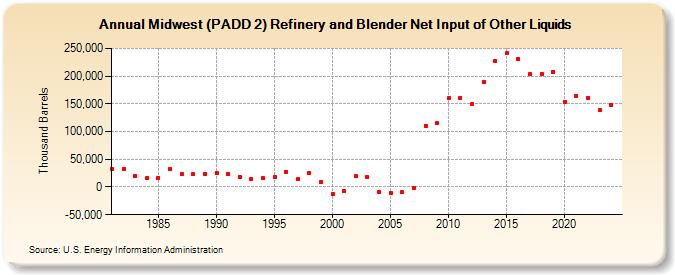
| Midwest (PADD 2) Refinery and Blender Net Input of Other Liquids (Thousand Barrels) | ||||||||
| Decade | Year-0 | Year-1 | Year-2 | Year-3 | Year-4 | Year-5 | Year-6 | Year-7 | Year-8 | Year-9 |
|---|---|---|---|---|---|---|---|---|---|---|
| 1980's | 32,571 | 33,050 | 20,641 | 15,459 | 16,365 | 32,406 | 22,605 | 22,886 | 23,698 | |
| 1990's | 25,268 | 24,004 | 18,645 | 14,934 | 15,746 | 17,902 | 27,941 | 14,184 | 25,395 | 9,354 |
| 2000's | -13,307 | -7,507 | 19,652 | 17,522 | -9,041 | -10,854 | -9,898 | -1,123 | 110,842 | 115,325 |
| 2010's | 159,918 | 160,721 | 149,188 | 190,129 | 226,741 | 241,434 | 231,294 | 202,914 | 204,476 | 208,015 |
| 2020's | 153,738 | 164,890 | 161,397 | 138,852 |
| - = No Data Reported; -- = Not Applicable; NA = Not Available; W = Withheld to avoid disclosure of individual company data. |
| Release Date: 3/29/2024 |
| Next Release Date: 8/30/2024 |