|
Download Data (XLS File) |
|
||||||||
|
||||||||
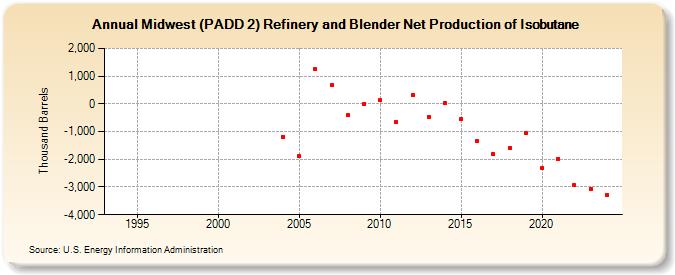
| Midwest (PADD 2) Refinery and Blender Net Production of Isobutane (Thousand Barrels) | ||||||||
| Decade | Year-0 | Year-1 | Year-2 | Year-3 | Year-4 | Year-5 | Year-6 | Year-7 | Year-8 | Year-9 |
|---|---|---|---|---|---|---|---|---|---|---|
| 1990's | W | W | W | W | W | W | W | |||
| 2000's | W | W | W | W | -1,185 | -1,881 | 1,241 | 665 | -411 | 8 |
| 2010's | 125 | -646 | 311 | -468 | 22 | -540 | -1,334 | -1,810 | -1,580 | -1,052 |
| 2020's | -2,312 | -1,981 | -2,943 | -3,058 |
| - = No Data Reported; -- = Not Applicable; NA = Not Available; W = Withheld to avoid disclosure of individual company data. |
| Release Date: 8/30/2024 |
| Next Release Date: 8/29/2025 |