This Week in Petroleum
Release Date: May 8, 2024
Next Release Date: May 15, 2024
| Note: Weekly heating oil and propane prices are only collected during the heating season, which extends from October through March and will return on October 9, 2024. From April through September, heating oil and propane prices are collected once a month (the second Monday of the month) and published the following week at Heating Oil and Propane Update. |
| Note: Weekly heating oil and propane prices are only collected during the heating season, which extends from October through March and will return on October 9, 2024. From April through September, heating oil and propane prices are collected once a month (the second Monday of the month) and published the following week at Heating Oil and Propane Update. |
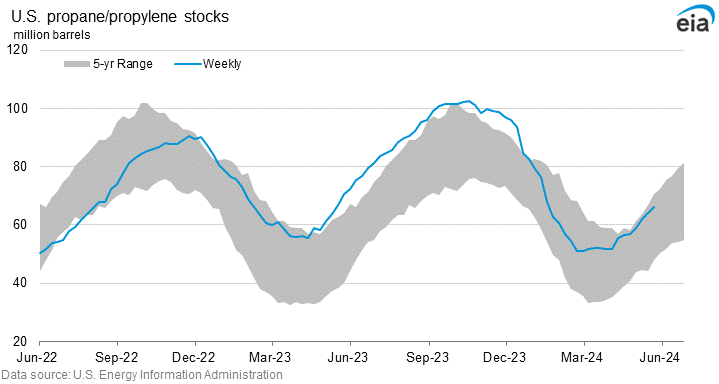
Propane/propylene stocks (million barrels) and days of supply
| Year ago | Most recent | |||||||
|---|---|---|---|---|---|---|---|---|
| 05/05/23 | 05/03/24 | 04/26/24 | 04/19/24 | 04/12/24 | 04/05/24 | 03/29/24 | 03/22/24 | |
| U.S. | 61.404 | 59.092 | 56.922 | 56.675 | 55.694 | 51.705 | 51.810 | 52.164 |
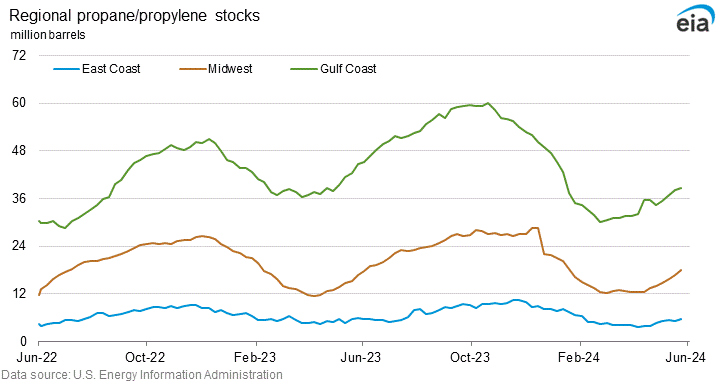
| East Coast (PADD 1) | 5.598 | 5.080 | 4.661 | 3.937 | 3.830 | 3.602 | 4.059 | 4.039 |
| New England (PADD 1A) | 0.082 | 0.185 | 0.188 | 0.202 | 0.227 | 0.276 | 0.332 | 0.407 |
| Central Atlantic (PADD 1B) | 4.101 | 3.359 | 3.033 | 2.366 | 2.357 | 2.273 | 2.743 | 2.581 |
| Lower Atlantic (PADD 1C) | 1.415 | 1.536 | 1.440 | 1.369 | 1.246 | 1.053 | 0.984 | 1.051 |
| Midwest (PADD 2) | 13.654 | 14.789 | 13.962 | 13.384 | 12.540 | 12.490 | 12.584 | 12.760 |
| Gulf Coast (PADD 3) | 39.505 | 35.494 | 34.459 | 35.631 | 35.539 | 32.112 | 31.550 | 31.616 |
| Rocky Mtn & West Coast (PADD 4 & 5) | 2.647 | 3.729 | 3.840 | 3.723 | 3.785 | 3.501 | 3.617 | 3.749 |
| Nonfuel Use | NA | NA | NA | NA | NA | NA | NA | NA |
| Year ago | Most recent | |||||||
|---|---|---|---|---|---|---|---|---|
| 05/05/23 | 05/03/24 | 04/26/24 | 04/19/24 | 04/12/24 | 04/05/24 | 03/29/24 | 03/22/24 | |
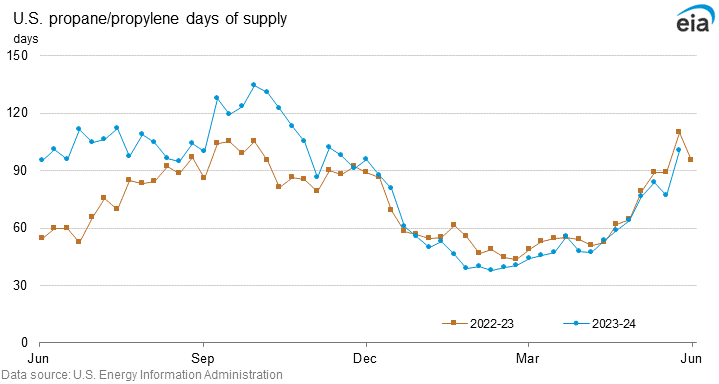
| U.S. | 79.1 | 76.5 | 63.7 | 58.9 | 53.5 | 47.0 | 47.9 | 55.8 |
| Note: Days of Supply calculated as: U.S. propane/propylene stocks / Four-week average U.S. propane/propylene product supplied (implied demand) | ||||||||
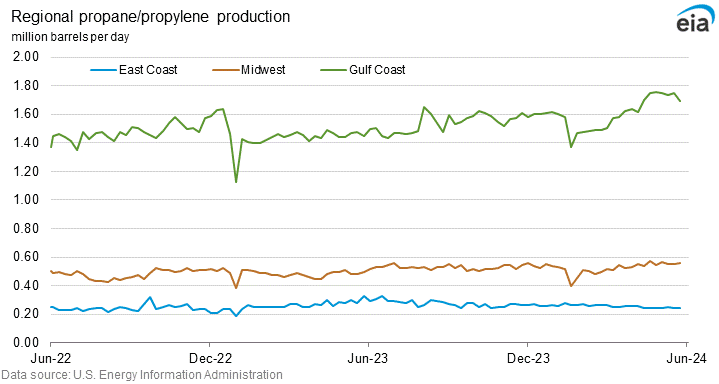
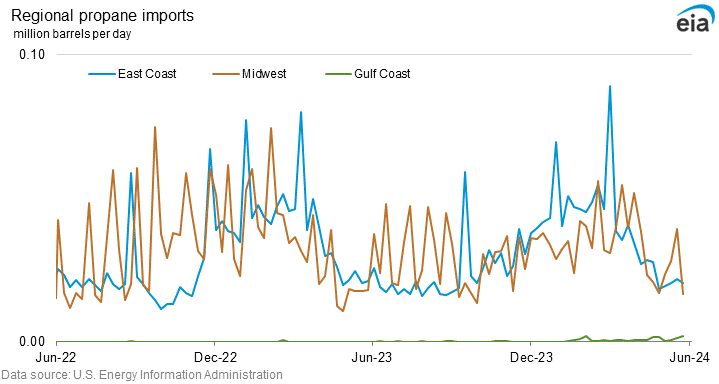
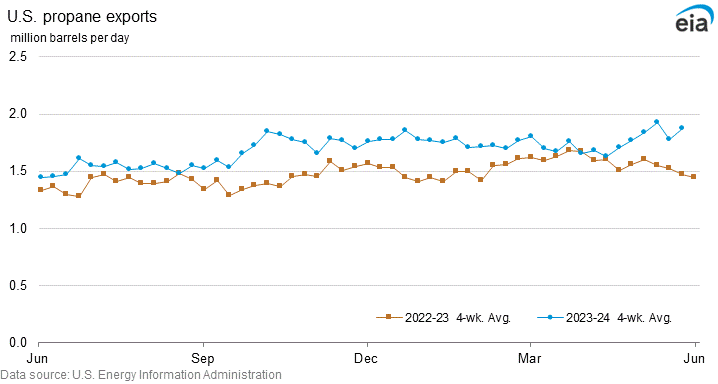
Regional propane and/or propylene production, imports, U.S. exports (million barrels per day)
| Year ago | Four-week averages | Year ago | Week ending | |||||
|---|---|---|---|---|---|---|---|---|
| 05/05/23 | 05/03/24 | 04/26/24 | 04/19/24 | 05/05/23 | 05/03/24 | 04/26/24 | 04/19/24 | |
| U.S. | 2.478 | 2.794 | 2.757 | 2.726 | 2.459 | 2.821 | 2.796 | 2.823 |
| East Coast (PADD 1) | 0.279 | 0.246 | 0.249 | 0.252 | 0.276 | 0.246 | 0.245 | 0.247 |
| Midwest (PADD 2) | 0.496 | 0.556 | 0.553 | 0.549 | 0.512 | 0.566 | 0.545 | 0.572 |
| Gulf Coast (PADD 3) | 1.461 | 1.737 | 1.704 | 1.674 | 1.440 | 1.747 | 1.755 | 1.750 |
| Year ago | Four-week averages | Year ago | Week ending | |||||
|---|---|---|---|---|---|---|---|---|
| 05/05/23 | 05/03/24 | 04/26/24 | 04/19/24 | 05/05/23 | 05/03/24 | 04/26/24 | 04/19/24 | |
| U.S. | 0.089 | 0.083 | 0.092 | 0.102 | 0.081 | 0.075 | 0.083 | 0.091 |
| East Coast (PADD 1) | 0.024 | 0.023 | 0.025 | 0.029 | 0.021 | 0.019 | 0.018 | 0.028 |
| Midwest (PADD 2) | 0.020 | 0.021 | 0.025 | 0.033 | 0.018 | 0.024 | 0.017 | 0.021 |
| Gulf Coast (PADD 3) | 0.000 | 0.001 | 0.001 | 0.001 | 0.000 | 0.000 | 0.002 | 0.002 |
| Year ago | Four-week averages | Year ago | Week ending | |||||
|---|---|---|---|---|---|---|---|---|
| 05/05/23 | 05/03/24 | 04/26/24 | 04/19/24 | 05/05/23 | 05/03/24 | 04/26/24 | 04/19/24 | |
| U.S. exports | 1.605 | 1.841 | 1.773 | 1.705 | 1.642 | 1.765 | 1.689 | 2.335 |
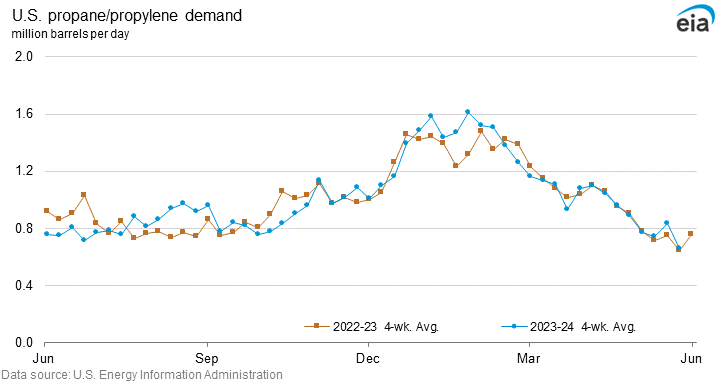
Propane/propylene demand (million barrels per day)
| Year ago | Four-week averages | Year ago | Week ending | |||||
|---|---|---|---|---|---|---|---|---|
| 05/05/23 | 05/03/24 | 04/26/24 | 04/19/24 | 05/05/23 | 05/03/24 | 04/26/24 | 04/19/24 | |
| Propane/Propylene | 0.776 | 0.772 | 0.893 | 0.962 | 0.454 | 0.821 | 1.155 | 0.439 |
Abbreviations: NA = Not Available | W = Data Withheld