Form EIA-930 data collection provides a centralized and comprehensive source for hourly operating data about the high-voltage bulk electric power grid in the Lower 48 states. We collect the data from the electricity balancing authorities (BAs) that operate the grid.
Historical data submissions are available via the API and the interactive webpage starting with January 1, 2019. For a longer time series, please find a downloadable flat files of submissions back to the beginning of the collection under the Download the Data tab on the main webpage.
XLS EIA-930 data reference tables
Form EIA-930A data collection provides a centralized inventory of generators and plant codes collected on Form EIA-860 that appear in the population of generators reported in the data year in the Hourly Electric Grid Monitor. Data for the calendar years 2023 to 2024 are available for download at the links below:
XLS
EIA-930A 2024 data
XLS
EIA-930A 2023 data
Balancing authorities, a functional role defined by the North American Electric Reliability Corporation (NERC), are mainly responsible for balancing electricity supply, demand, and interchange on their electric systems in real time.
We use BA acronyms based on official NERC BA codes, so codes may not match the full name of BAs because of changes in corporate ownership, mergers, or other business transactions.
XLS All EIA-930 data reference tables
Form EIA-930 contains the following hourly data elements:
DATA ELEMENT DESCRIPTIONS
Demand and demand by subregion
Demand is a calculated value representing the amount of electricity load within a BA's electric system. A BA derives
its demand value by taking the total metered net electricity generation within its electric system and subtracting
the total metered net electricity interchange occurring between the BA and its neighboring BAs.
For select BAs, demand by subregion data provide demand at a further level of geographic disaggregation (for example, load zones, weather zones, operating company areas, local BAs, etc.) within a BA's electric system. A BA’s reporting demand by subregion section below provides more information on subregions.
Demand forecast
Each BA produces a day-ahead electricity demand forecast for every hour of the next day. These forecasts help BAs
plan for and coordinate the reliable operation of their electric system.
Net generation and net generation by energy source
Net generation represents the metered output of electric generating units in a BA's electric system. This generation
only includes generating units that are managed by a BA or whose operations are visible to a BA.
Generators on the distribution system—both large-scale resources and small-scale distributed resources, such as rooftop solar photovoltaic (PV) systems—are typically not included.
BAs report generation from dual-fuel (switching from one fuel to another) and multiple-fuel (using multiple fuels simultaneously) generators under the actual energy source used, if known, and under the generator's primary energy source, if not known.
To maintain generator confidentiality, generation may sometimes be reported in the Other category if too few generators are reported for a particular energy source category.
In some of our electricity publications, we report generation from all utility-scale generating units in the United States. BAs only meter generating units that are from a subset of all utility-scale generating units. As a result, when hourly generation from the Hourly Electric Grid Monitor is aggregated to monthly or annual levels, the results will be lower than monthly and annual aggregations in other electricity publications.
Total interchange and interchange with directly interconnected BAs
Interchange is the net metered tie line flow from one BA to another
directly interconnected BA. Total net interchange is the net sum of all interchange occurring between a BA and its
directly interconnected neighboring BAs.
Negative interchange values indicate net inflows, and positive interchange values indicate net outflows.
We estimate hourly CO2 emissions from all electric-generating units in the Lower 48 states that are both metered by BAs and used to serve required demand. We base these estimates on the hourly net generation BAs report to us.
In some of our other electricity publications, we report generation from all utility-scale generating units in the United States. However, BAs only meter generating units from a subset of utility-scale generating units. As a result, when hourly generation from the Hourly Electric Grid Monitor is aggregated to monthly or annual levels, the results will be lower than the monthly and annual generation aggregations in other electricity publications.
We use average annual CO2 emissions factors (pounds [lbs] of CO2 per kilowatthour [kWh] of generation) to estimate CO2 emissions for each BA. We calculate these factors for natural gas, coal, and petroleum using reported generation and our estimated emissions for generators operated by electric utilities and independent power producers within each BA fleet of generators consuming those fuels. CO2 emissions from fuels other than natural gas, coal, and petroleum use the same emissions factor for the entire United States. We exclude data from combined-heat-and-power facilities. We estimate CO2 emissions imported from Canada and Mexico by applying the average U.S. emissions rate per megawatthour of generation to the megawatthours of imports.
We estimate CO2 emissions for generators operated by electric utilities and independent power producers by using the fuel consumption (in million British thermal units [MMBtu]) reported on Form EIA-923 and average CO2 emission factors (kilogram [kg] per MMBtu) published by the U.S. Environmental Protection Agency. You can find more information on the method of estimating CO2 emissions at power plants in the technical notes of the Electric Power Annual.
We calculate both the CO2 emissions intensity of generation (or, the production emissions intensity) and the CO2 emissions intensity of load (or, the consumption emissions intensity) for each BA, for every hour that has the necessary data submitted.
To calculate the CO2 emissions intensity of load, we associate estimated emissions with the transfer of electricity between BAs using a multiregional input–output model (MRIO)1. To calculate both the temporal and geographic variability of emissions intensity consumed within each BA, we assign emissions intensities to both the imported and exported electricity that is transferred between all BAs in a given hour.
The Data notes and Data quality sections include more detailed discussions of these data elements.
BAs report all data as hourly integrated values, meaning they are time-weighted hourly averaged values. Hourly data are published using the hour ending time reporting convention. For example, the data for the hour ending 1:00 a.m. on August 1, 2019, is reported with a timestamp of August 1, 2019, 1:00 a.m.
We publish BA data using the local time zone chosen by each BA. A few BAs have chosen local time zones users might not expect:
For BAs that report using local time zones that observe daylight savings time, the March daylight savings transition day will have 23 hours of data while the November daylight savings transition day will have 25 hours of data.
When data are available
Hourly data for BAs, regions, and the Lower 48 states are available on the following schedule:
Daily data for each data element are generally available at the same time as hourly data for that data element, with the exception that yesterday's daily demand data are typically available by 10:00 a.m. eastern time today.
Where data are available
Customizable Dashboards
The Hourly Electric Grid Monitor includes pre-designed dashboards highlighting information about individual BAs and regions of the country. These dashboards can be customized, saved, and shared with others.
The Hourly Electric Grid Monitor shows a U.S. Electricity Overview by default, but other dashboards may be displayed on the Dashboard tab by making a selection from the View dropdown box in the upper left of the tab.
Our API
You can access data reported on Form EIA-930 using our API. You can access a link to this API on the Dashboard tab by choosing the Download Data icon in the upper right of the tab. Click on the desired data metric under the API tab that appears.
Downloadable .csv files
You can download a .csv data file that contain six months of data from the Dashboard tab by choosing the Download Data icon in the upper right of the tab. In the pop-up that appears, click on the column labeled Six-Month Files, then choose a desired year and the desired data to download.
Balance files contain hourly demand forecast, demand, net generation, total interchange, and net generation by energy source for each BA in the Lower 48 states.
Interchange files contain hourly interchange with directly interconnected BAs for each BA in the Lower 48 states.
Subregion files contain hourly demand by subregion for select BAs.
Downloadable .xlsx files
You can download the full reported history for individual BAs and regions as an .xlsx data file from the Dashboard tab by choosing the Download Data icon in the upper right of the tab. In the pop-up that appears, click on the column labeled Balancing Authority/Regional Files, then choose the desired region or BA to download.
Downloading hourly CO2 emissions data
On the dashboard of the Hourly Electric Grid Monitor, select the Download Data option and then Balancing Authority/Regional Files. Scroll down and click on the hyperlink corresponding to United States Lower 48 for total U.S. emissions or the individual Balancing Authority/Regional Files for each regional file. The downloaded file includes hourly and daily CO2 emissions estimates beginning with July 1, 2018, data on the tabs labeled Published Hourly Data and Published Daily Data. The Hourly Charts tab includes charts displaying hourly CO2 emissions for the past 14 days. The Daily Charts tab includes charts displaying daily CO2 emissions for the past 365 days.
We calculate regional and U.S. data by aggregating reported BA data into 13 regions and in total for the Lower 48 states.
We calculate daily data by aggregating hourly data for BAs, regions, and the Lower 48 states.
Because BAs have different reporting time zones, viewing daily aggregations in the time zone specified below will provide the most current daily aggregation available.
List of regions
List of balancing authorities
XLS All EIA-930 data reference tables
Some BAs have unique characteristics that affect their data.
BA reporting demand by subregion
BAs that calculate hourly demand values for subregions (for example, load zones, weather zones, operating company areas, local BAs, etc.) within their system in the normal course of business began reporting subregional demand, beginning July 1, 2018.
Currently, eight BAs report demand by subregion:
The links below will direct you to maps of each BA's subregions; the XLS EIA-930 data reference tables provide a list of subregion codes and names.
Generation-only BAs consist of a power plant or group of power plants and do not directly serve retail customers. Therefore, they only report net generation and interchange and do not report demand or demand forecasts.
Eleven active BAs are generation-only:
Most BAs produce electricity within their BA area. However, the following active BA has a small number of local generators that do not always produce electricity, so it will not always have net generation to report:
Entities occasionally stop performing the BA role because their electric system is incorporated into another BA's system or they have made other arrangements. Five BAs retired after July 1, 2015, the first date of EIA-930 data availability:
Form EIA-930 data attempts to represent, as purely as possible, a physical picture of supply, demand, and energy flow (interchange) on the U.S. electric grid. For the purposes of Form EIA-930, interchange is the physical flow of electricity metered at the tie line boundaries between electric systems. Net generation is a metered value of the output of generating units in the BA. Demand (or load) is a calculated value based on the activity occurring within the tie line boundaries of the electric system.
This physical picture of BA operations is not the way many electric systems account for and report how they dispatch their generators, manage interchange, and balance their systems. Utilities sometimes enter into commercial arrangements with other systems including:
Impact of pseudo-ties and dynamic scheduling on demand, net generation, and interchange
If operating data were reported with these commercial arrangements incorporated, then:
To incorporate commercial arrangements, such as dynamic scheduling arrangements and interchanges on pseudo ties, BAs normally adjust their metered physical flow values to produce this alternative view of grid operations.
Because physical tie line flows and generating unit output are metered, we ask BAs to report the physical values of net generation and total interchange for EIA-930 data collection. In some cases, this adjustment causes significant changes to reported demand values, which we derive from net generation and total interchange. We are working with respondents to make corrections when data submissions erroneously include dynamic scheduling or pseudo-tie arrangements.
Impact of pseudo-ties and dynamic scheduling on demand forecast
Electric systems produce demand forecasts aligned with the way they normally operate and account for electricity on their system. So, the demand forecasts incorporate the effects of commercial arrangements such as dynamic scheduling and pseudo-ties. We have not asked respondents to produce a demand forecast consistent with a purely physical picture of their operations. This approach means that for some BAs, where a significant portion of their demand is outside their system or where other BAs control a significant amount of demand inside their system, the comparison between actual and forecast demand is not very meaningful.
Those systems include:
We designed EIA-930 to balance timely reporting of electric system operating data with a reasonably accurate level of data quality. As a result, we collect the various data elements with different time lags, and we collect certain data elements multiple times. For example, we collect demand data in two ways: every hour after the operating hour is completed and again at 7:00 a.m. the next day for every hour of the previous day. The reported values may or not be the same, depending on the source of the data and intermittent revisions.
BAs report data from internal systems that are subject to disruption or errors due to their near real-time collection. To provide some minimum level of data quality, we perform basic imputation procedures to fill in gaps or correct obvious errors. Notwithstanding the as-is nature of the collection, we expect respondents to correct anomalous values for the historical record.
We publish hourly operating data from individual BAs exactly as we received the data. Hourly U.S. and regional aggregations and all daily data aggregations incorporate procedures for handling anomalous values of some data elements. We advise caution when using these data.
The data BAs report on the Form EIA-930 represent best values at the time of reporting, but various reporting issues may limit the quality of these data, including:
The methodology for assigning CO2 emissions to the interchange of electricity between BAs involves constructing a Multiregional Input-Output (MRIO) Model to assign an emissions intensity of exported and imported electricity between all BAs in a given hour.
A key assumption used for MRIO models is that the flows between areas are in balance. Due to reporting errors or discrepancies in the volume of transfers between BAs, the overall flow of energy may not balance. This will lead to imbalanced emissions totals. We adjust the emissions rates of specific fuels to balance to the national emissions estimate for each fuel; however, imbalances in the reported transfers will distort the emissions intensity of load. Data corrections will automatically recalculate the transfers upon receipt of new data.
The accuracy of our hourly CO2 emissions relies on the accuracy of the generation and interchange that BAs report on Form EIA-930. In some situations, BAs may not have detailed information about the actual fuels used to generate electricity at dual-fired or multiple-fuel generators. When the actual fuels consumed are unknown, Form EIA-930 directs BAs to report the energy source code for the primary fuel of the generator for the entire amount of generation. Confidentiality considerations may cause BAs to mask the generation from certain energy sources by reporting the generation using the Other category (OTH) as Form EIA-930 instructs. Inaccurate assignments of energy source resulting from these reporting practices may result in inaccurate estimates of CO2 emissions.
Form EIA-930 directs BAs to report electric system operations in as purely a physical way as possible. Therefore, BAs should ignore or exclude dynamic transfer arrangements implemented as either pseudo-ties or dynamic schedules from reporting. They should not adjust metered tie line flows, and actual demand and net generation should reflect only demand and net generation occurring within the BA's physical tie line boundaries. In some cases, it is not possible or practical for certain BAs to exclude all dynamic transfer arrangements. In these cases, we are working to reach agreements with the impacted BAs and their neighboring BAs to ensure consistent reporting of generation, demand, and interchange. This reporting may allocate generation to BAs that own or operate generating units physically located outside of the BAs metered tie line boundary. In turn, the associated CO2 emissions are also allocated to those same BAs.
Other sources of net generation data
We also publish net generation data in the Electric Power Monthly, Electric Power Annual, and by power plant in the Form EIA-923 detailed datasets. We collect these net generation data from a frame of all electric power plants that have at least 1 megawatt of generating capacity and that are connected to the electric grid. These data undergo a rigorous review process before publication.
Other sources of emissions data
We publish estimates of emissions by plant and region for CO2, sulfur dioxide (SO2), and nitrogen oxides (NOX) based on Form EIA-923 data. We also publish emissions factors annually with carbon factors provided by the U.S. Environmental Protection Agency.
Discrepancies between Hourly Electric Grid Monitor and our other data sources
Data published in the Hourly Electric Grid Monitor may differ substantially from data reported in our other publications. These data include the net generation totals and net generation by fuel type collected from individual generators on Form EIA-923 as well as the sales of electricity to ultimate customers data collected from load-serving entities on Form EIA-861, which are all published in the Electric Power Monthly series.
We collect these official statistical reports using data collection instruments with internal edits to ensure statistical quality not practical on the frequency and timescale of Form EIA-930.
To harmonize data reported between the Hourly Electric Grid Monitor and other EIA publications, we began collecting and publishing data collected on Form EIA-930A, which is an inventory of generators and plant codes collected on Form EIA-860 that appear in the population of generators reported in a given data year. Some generators that provide information on EIA-860 may not be directly metered by BAs. Other resources may not qualify as a valid response on the EIA-860 (either due to the generator being physically located outside the United States or because the individual generator is below the 1 megawatt threshold for reporting, usually the case for demand response resources that may participate in wholesale electric markets).
We use relationships among the data elements to check the quality of data reporting.
System energy balance: BAs typically derive the value for demand each hour from total interchange and net generation, which are both aggregated metered values. Typically, demand equals net generation minus total interchange.
Demand: Total demand should equal or approximate the sum of demand by subregion. Discrepancies may exist as a result of different methods for calculating these two data elements.
Net generation: Total net generation should equal the sum of net generation by energy source.
Internal interchange reporting consistency: We collect interchange data with each directly interconnected BA two days after the operating day. The timing of this collection takes advantage of a mandatory requirement—known as the interchange check-out process. In this check-out process, BAs agree on the interchange value with their neighboring BAs by the end of the next business day. However, for timelier reporting of interchange, we collect total interchange data one day after the operating day, before the check-out process.
External interchange reporting consistency: BAs are physically connected to their neighboring BAs by one or more transmission lines. These lines have meters that measure the flow of electricity between BAs. Interchange reported by BA 1 with BA 2 should be the exact reverse of the interchange reported by BA 2 with BA 1. For example, if BA 1 reports +100 MW interchange with BA 2, BA 2 should report -100 MW with BA 1.
Correcting incorrect interchange values for one or both of the BAs in a BA pair is particularly challenging because it is difficult to identify misreported data and the reason for mismatches. We have found that a number of BAs are not reporting using a data source with checked-out values. In addition, some BAs are not appropriately accounting for pseudo-ties or dynamic schedules in their reporting.
Not all BAs agree on which BAs they are directly connected to. We are working with respondents to correct these discrepancies.
Daylight saving time transition days are often misreported, with duplicate values reported for the same hour, a missing value for an hour, or incorrect timestamps for the daylight saving transition day. We monitor daylight saving time reporting issues and notify BAs to resubmit corrected data.
BAs occasionally report anomalous data values such as blank, zero, negative, and unreasonably high or low values. We perform a basic imputation process for several data elements.
We publish hourly BA data exactly as reported without imputation. Hourly U.S. and regional aggregations and all daily data aggregations incorporate our imputations.
Demand
We impute for anomalous values for total demand if the value is missing or reported as negative, zero, or at least 1.5 times greater than the maximum of past total demand values reported by that BA.
When imputing demand, we use the following steps:
Net generation
We impute for anomalous values for total net generation and net generation by energy source if the value is missing or reported as negative, zero, or at least 1.5 times greater than the maximum of past total net generation values reported by that BA, except when:
To impute net generation, we use the following steps:
Total interchange
We impute for anomalous values for total interchange if the value is as at least 1.5 times greater than the maximum of past positive total interchange values reported by that BA or at least 1.5 times less than the minimum of past negative total interchange values reported by that BA.
We impute anomalous values of total interchange with a value of 0.
When a major earthquake struck near Washington, DC, in 2011, two large nuclear units in Virginia went offline. The sudden loss of electric supply reverberated for 12 seconds across eastern North America.
Disturbances in the electric supply-demand balance can quickly spread across vast areas, as this video illustrates. The system recovered quickly because many power plants (also referred to as electric generators or generating units) across the area automatically detected the loss of electricity supply and immediately increased their output slightly. Collectively, they made up most of the loss.
Electric system disturbances occur too quickly to rely on human intervention to detect losses and to manually bring on new generating capacity. In this sense, system operators do not operate electric systems. Their job is to maintain conditions that allow an electric system to automatically maintain the balance of supply and demand by providing adequate electricity supply to meet demand and to respond to outages.
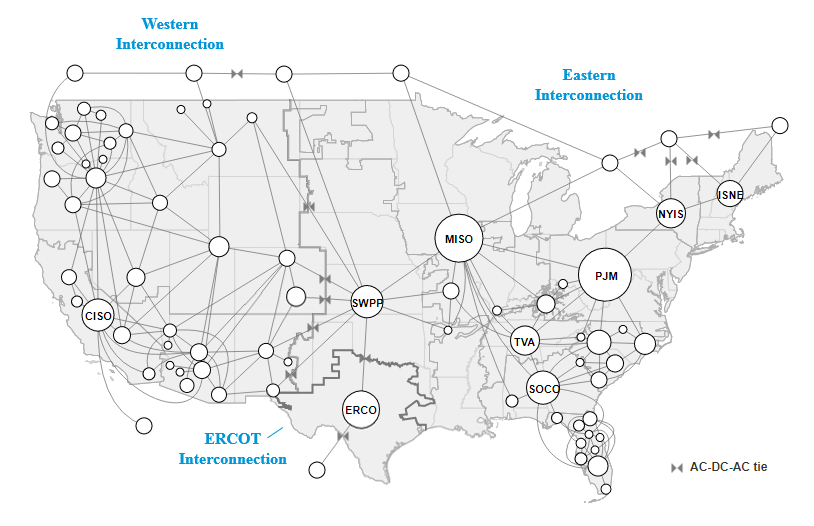
Electricity moves quickly over large areas in a vast high-voltage transmission network called the grid. The grid
covering the continental United States is divided into three separate interconnections.
The 2011 earthquake affected the Eastern Interconnection, the large electric system encompassing the area east of the Rocky Mountain states and a portion of northern Texas. The Western Interconnection encompasses the area from the Rockies to the West Coast. Most, but not all, of Texas is covered by the Electric Reliability Council of Texas (ERCOT) Interconnection and is operated by a single BA of the same name.
No single entity is responsible for the real-time operation of a given electric interconnection. Instead, BAs are responsible for maintaining operating conditions under mandatory reliability standards issued by the North American Electric Reliability Corporation (NERC) and approved by the U.S. Federal Energy Regulatory Commission (FERC) and regulators in Canada.
BAs maintain the appropriate conditions by ensuring that a sufficient supply of electricity is available to serve expected demand and by managing transfers of electricity with other BA systems. Each day, BAs forecast hourly electricity demand on their systems for the next day. The forecast reflects daily, weekly, and seasonal demand patterns plus expected weather conditions.
Based on the daily demand forecast, each BA coordinates which generating units will be available to run the next day. A utility serving as its own BA selects units from its own fleet of generators and other supply resources. In areas served by one of the large independent system operators (ISOs) or regional transmission organizations (RTOs), serving about two-thirds of the country, generators submit offers into the RTO/ISO's day-ahead energy market to generate power the next day. RTO/ISO day-ahead energy markets use sophisticated optimization models to select bids and set wholesale prices. These arrangements are financially binding, and generators who fail to perform as agreed may face financial penalties.
For simplicity, BAs usually record system operating information as time-weighted hourly averages instead of instantaneous values.
BA systems record the output of most—but not all—of their generators. The sum of these metered values for a system is called net generation.
BAs also record the flow of electricity over the transmission lines (called tie lines) that directly connect them to neighboring BAs. The flow of electricity into or out of a BA's system from neighboring systems is called interchange. Total system demand is derived by subtracting actual interchange from net generation.
Electric systems use alternating current (AC) electricity. Electric systems in North America are designed and operated to maintain an alternating current wave frequency of 60 cycles per second (hertz). Frequency is the primary measure that system operators use to assess the real-time state of the interconnection.
Deviations from 60 hertz (Hz) indicate instantaneous mismatches between electricity supply and demand. When frequency is higher than 60 Hz, the system has more supply than demand. When frequency is lower than 60 Hz, the system has more demand than available supply. Deviations between electricity supply and demand outside a narrow frequency band can result in electric system failures.
Electricity flows freely within an interconnection. Transfers of electricity from one BA's system to another's are not directed along a certain transmission path. Instead, the electricity travels along all interconnecting paths based on the laws of physics.
A planned transfer of power between BAs doesn't happen through a system of opening and closing valves or lines. Transfers happen when BAs coordinate a controlled imbalance in their systems between supply and demand. For example, BA 1 will increase the output of its generators and BA 2 will decrease the output of its generators by the same amount at the same time. The result is that an incremental amount of electricity will flow between the two systems.
Electricity does not flow freely between the interconnections. Interconnections are linked through a small number of special transmission ties. These ties include a facility that converts the alternating current (AC) of one interconnection into direct current (DC) and then converts the direct current into the alternating current of the second interconnection.
These AC-DC-AC ties act like valves. The ties prevent electrical disturbances in one interconnection from spreading
into other interconnections. Most of the ties have limited transfer capacity. However, the ties between Quebec and
New York and New England in the Eastern Interconnection have substantial transfer capacity to move hydroelectric
power from Quebec to customers in the United States.
1"Tracking emissions in the US electricity system", by Jacques A. de Chalendar, John Taggart and Sally M. Benson. Proceedings of the National Academy of Sciences Dec 2019, 116 (51) 25497-25502; DOI
We publish hourly operating data for individual BAs exactly as we received these data. However, hourly U.S. and regional aggregations and all daily data aggregations incorporate procedures for handling anomalous values of some data elements. We advise caution when using these data.