|
Download Data (XLS File) |
|
||||||||
|
||||||||
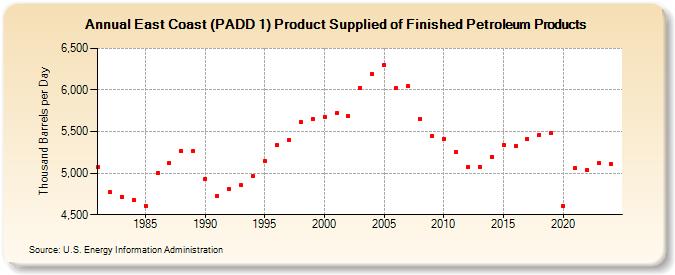
| East Coast (PADD 1) Product Supplied of Finished Petroleum Products (Thousand Barrels per Day) | ||||||||
| Decade | Year-0 | Year-1 | Year-2 | Year-3 | Year-4 | Year-5 | Year-6 | Year-7 | Year-8 | Year-9 |
|---|---|---|---|---|---|---|---|---|---|---|
| 1980's | 5,074 | 4,772 | 4,718 | 4,682 | 4,610 | 5,003 | 5,125 | 5,268 | 5,264 | |
| 1990's | 4,931 | 4,726 | 4,810 | 4,854 | 4,961 | 5,146 | 5,334 | 5,398 | 5,611 | 5,651 |
| 2000's | 5,680 | 5,721 | 5,687 | 6,024 | 6,196 | 6,298 | 6,021 | 6,042 | 5,655 | 5,450 |
| 2010's | 5,411 | 5,254 | 5,072 | 5,077 | 5,198 | 5,338 | 5,329 | 5,413 | 5,464 | 5,481 |
| 2020's | 4,603 | 5,063 | 5,041 | 5,123 |
| - = No Data Reported; -- = Not Applicable; NA = Not Available; W = Withheld to avoid disclosure of individual company data. |
| Release Date: 6/28/2024 |
| Next Release Date: 8/30/2024 |