|
Download Data (XLS File) |
|
||||||||
|
||||||||
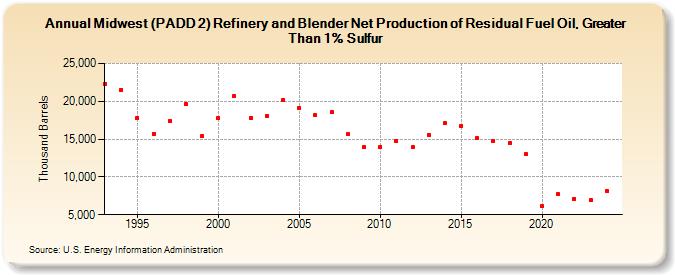
| Midwest (PADD 2) Refinery and Blender Net Production of Residual Fuel Oil, Greater Than 1% Sulfur (Thousand Barrels) | ||||||||
| Decade | Year-0 | Year-1 | Year-2 | Year-3 | Year-4 | Year-5 | Year-6 | Year-7 | Year-8 | Year-9 |
|---|---|---|---|---|---|---|---|---|---|---|
| 1990's | 22,333 | 21,556 | 17,778 | 15,736 | 17,400 | 19,683 | 15,419 | |||
| 2000's | 17,778 | 20,677 | 17,850 | 18,102 | 20,174 | 19,166 | 18,160 | 18,535 | 15,629 | 13,952 |
| 2010's | 14,014 | 14,739 | 13,950 | 15,606 | 17,070 | 16,667 | 15,103 | 14,785 | 14,527 | 12,973 |
| 2020's | 6,125 | 7,695 | 7,098 | 6,905 | 8,108 |
| - = No Data Reported; -- = Not Applicable; NA = Not Available; W = Withheld to avoid disclosure of individual company data. |
| Release Date: 6/30/2025 |
| Next Release Date: 8/29/2025 |