|
Download Data (XLS File) |
|
||||||||
|
||||||||
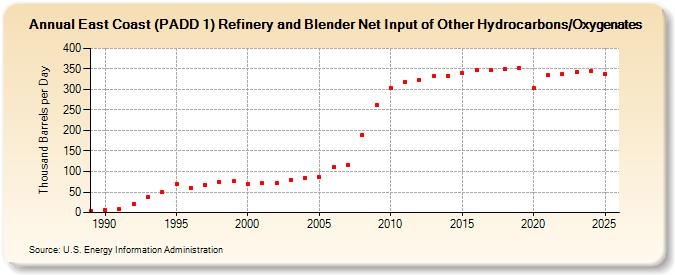
| East Coast (PADD 1) Refinery and Blender Net Input of Other Hydrocarbons/Oxygenates (Thousand Barrels per Day) | ||||||||
| Decade | Year-0 | Year-1 | Year-2 | Year-3 | Year-4 | Year-5 | Year-6 | Year-7 | Year-8 | Year-9 |
|---|---|---|---|---|---|---|---|---|---|---|
| 1980's | 4 | |||||||||
| 1990's | 6 | 8 | 22 | 38 | 49 | 69 | 61 | 68 | 74 | 76 |
| 2000's | 70 | 71 | 71 | 79 | 85 | 86 | 111 | 117 | 190 | 262 |
| 2010's | 303 | 318 | 324 | 332 | 333 | 340 | 348 | 348 | 349 | 352 |
| 2020's | 304 | 334 | 338 | 343 |
| - = No Data Reported; -- = Not Applicable; NA = Not Available; W = Withheld to avoid disclosure of individual company data. |
| Release Date: 6/28/2024 |
| Next Release Date: 8/30/2024 |