|
Download Data (XLS File) |
|
||||||||
|
||||||||
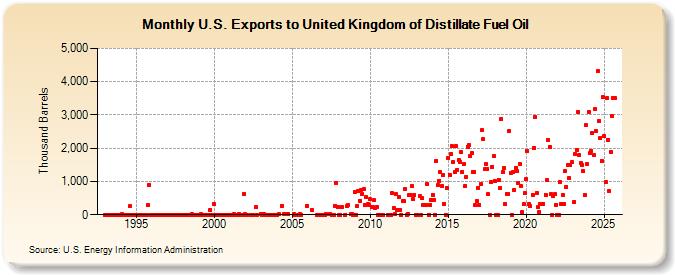
| U.S. Exports to United Kingdom of Distillate Fuel Oil (Thousand Barrels) | ||||||||
| Year | Jan | Feb | Mar | Apr | May | Jun | Jul | Aug | Sep | Oct | Nov | Dec |
|---|---|---|---|---|---|---|---|---|---|---|---|---|
| 1993 | 0 | 0 | 1 | 0 | 1 | 0 | 1 | 1 | 2 | 3 | 0 | |
| 1994 | 1 | 14 | 0 | 1 | 0 | 0 | 250 | 0 | 1 | 1 | ||
| 1995 | 1 | 1 | 0 | 1 | 1 | 0 | 1 | 1 | 287 | 894 | 4 | |
| 1996 | 2 | 1 | 1 | 1 | 0 | 3 | 2 | 0 | 1 | 1 | ||
| 1997 | 1 | 1 | 1 | 1 | 0 | 4 | 4 | 5 | 3 | 1 | 6 | 2 |
| 1998 | 1 | 4 | 4 | 4 | 0 | 1 | 1 | 9 | 2 | 2 | 2 | 0 |
| 1999 | 2 | 1 | 10 | 1 | 1 | 3 | 1 | 2 | 1 | 155 | 3 | 2 |
| 2000 | 316 | 0 | 1 | 1 | 2 | 1 | 1 | 2 | 3 | 1 | 1 | 1 |
| 2001 | 1 | 1 | 0 | 15 | 1 | 1 | 0 | 16 | 0 | 0 | 1 | 631 |
| 2002 | 19 | 0 | 0 | 0 | 0 | 221 | 0 | |||||
| 2003 | 15 | 1 | 14 | 0 | 5 | 2 | 0 | 0 | 1 | |||
| 2004 | 0 | 11 | 277 | 15 | 15 | 16 | ||||||
| 2005 | 17 | 0 | 0 | 16 | 1 | 273 | ||||||
| 2006 | 151 | 4 | 1 | 2 | ||||||||
| 2007 | 1 | 2 | 15 | 15 | 0 | 0 | 274 | 957 | 238 | |||
| 2008 | 0 | 2 | 246 | 0 | 253 | 283 | 8 | 23 | 0 | |||
| 2009 | 684 | 0 | 255 | 712 | 425 | 736 | 624 | 766 | 303 | 532 | 311 | 299 |
| 2010 | 461 | 217 | 219 | 432 | 216 | 224 | 1 | 0 | 0 | 1 | 1 | |
| 2011 | 0 | 0 | 640 | 204 | 28 | 609 | 131 | 525 | 140 | |||
| 2012 | 0 | 412 | 400 | 775 | 0 | 36 | 600 | 603 | 868 | 471 | 598 | 5 |
| 2013 | 0 | 549 | 0 | 501 | 300 | 301 | 301 | 921 | 0 | 300 | 450 | |
| 2014 | 602 | 451 | 0 | 1,626 | 900 | 1,024 | 1,283 | 862 | 1,193 | 326 | 0 | 808 |
| 2015 | 1,717 | 1,207 | 1,821 | 2,051 | 1,585 | 1,282 | 2,058 | 1,359 | 1,647 | 1,594 | 1,887 | 1,274 |
| 2016 | 1,521 | 861 | 1,137 | 2,049 | 2,089 | 1,761 | 1,858 | 1,293 | 1,281 | 284 | 401 | 814 |
| 2017 | 300 | 927 | 2,538 | 2,269 | 1,367 | 1,521 | 1,389 | 608 | 0 | 989 | 1,449 | 1,757 |
| 2018 | 1,025 | 1 | 1 | 1,057 | 792 | 2,876 | 1,282 | 1,411 | 309 | 627 | 618 | 2,520 |
| 2019 | 1,266 | 0 | 1,284 | 744 | 1,416 | 1,307 | 966 | 1,537 | 851 | 80 | 322 | 650 |
| 2020 | 1,068 | 1,930 | 327 | 256 | 603 | 2,006 | 2,933 | 656 | 223 | 95 | 321 | |
| 2021 | 324 | 606 | 1,031 | 2,232 | 2,041 | 613 | 0 | 565 | 614 | 300 | ||
| 2022 | 0 | 0 | 986 | 327 | 603 | 324 | 1,310 | 844 | 1,480 | 1,100 | 1,499 | 1,574 |
| 2023 | 100 | 1,545 | 1,850 | 3,096 | 1,795 | 1,243 | 1,495 | 1,303 | 600 | 2,678 | 902 | |
| 2024 | 3,097 | 1,539 | 1,929 | 2,166 | ||||||||
| - = No Data Reported; -- = Not Applicable; NA = Not Available; W = Withheld to avoid disclosure of individual company data. |
| Release Date: 6/28/2024 |
| Next Release Date: 7/31/2024 |