|
Download Data (XLS File) |
|
||||||||
|
||||||||
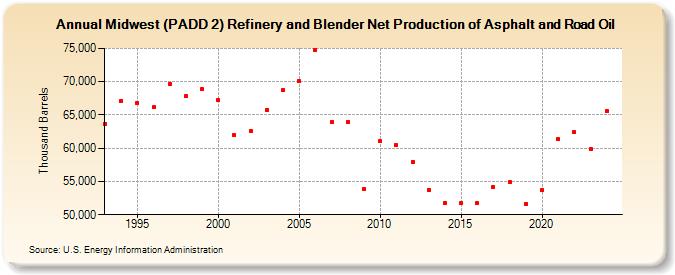
| Midwest (PADD 2) Refinery and Blender Net Production of Asphalt and Road Oil (Thousand Barrels) | ||||||||
| Decade | Year-0 | Year-1 | Year-2 | Year-3 | Year-4 | Year-5 | Year-6 | Year-7 | Year-8 | Year-9 |
|---|---|---|---|---|---|---|---|---|---|---|
| 1990's | 63,669 | 67,103 | 66,818 | 66,128 | 69,678 | 67,821 | 68,827 | |||
| 2000's | 67,177 | 61,953 | 62,656 | 65,790 | 68,677 | 70,042 | 74,796 | 63,907 | 63,914 | 53,892 |
| 2010's | 61,034 | 60,464 | 57,937 | 53,781 | 51,797 | 51,690 | 51,748 | 54,178 | 54,850 | 51,649 |
| 2020's | 53,699 | 61,363 | 62,419 | 59,838 |
| - = No Data Reported; -- = Not Applicable; NA = Not Available; W = Withheld to avoid disclosure of individual company data. |
| Release Date: 3/29/2024 |
| Next Release Date: 8/30/2024 |