|
Download Data (XLS File) |
|
||||||||
|
||||||||
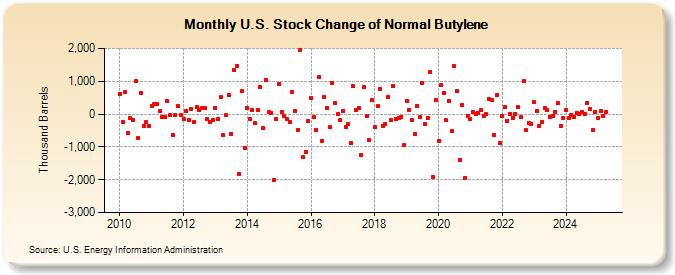
| U.S. Stock Change of Normal Butylene (Thousand Barrels) | ||||||||
| Year | Jan | Feb | Mar | Apr | May | Jun | Jul | Aug | Sep | Oct | Nov | Dec |
|---|---|---|---|---|---|---|---|---|---|---|---|---|
| 2010 | 611 | -227 | 668 | -583 | -119 | -193 | 996 | -739 | 655 | -360 | -246 | -367 |
| 2011 | 248 | 302 | 316 | 84 | -100 | -97 | 390 | -32 | -623 | -34 | 242 | -42 |
| 2012 | -164 | 80 | -175 | 155 | -255 | 221 | 117 | 195 | 180 | -154 | -229 | -178 |
| 2013 | 189 | -162 | 517 | -635 | -33 | 579 | -604 | 1,344 | 1,463 | -1,824 | 688 | -1,039 |
| 2014 | 182 | -160 | 120 | -284 | 117 | 829 | -439 | 1,044 | 59 | 43 | -2,014 | -151 |
| 2015 | 905 | 61 | -65 | -143 | -235 | 661 | 89 | -476 | 1,945 | -1,322 | -1,152 | -201 |
| 2016 | 490 | -83 | -486 | 1,126 | -813 | 527 | 180 | -407 | 934 | 342 | 4 | -189 |
| 2017 | 100 | -389 | -308 | -867 | 841 | 127 | 175 | -1,244 | 823 | -56 | -792 | 425 |
| 2018 | -400 | 239 | 776 | -349 | -294 | 517 | -193 | 864 | -148 | -125 | -78 | -938 |
| 2019 | 385 | 138 | -183 | -619 | 240 | -101 | 947 | -309 | -119 | 1,295 | -1,915 | 439 |
| 2020 | -815 | 879 | 645 | -183 | 389 | -518 | 1,463 | 688 | -1,384 | 287 | -1,954 | -50 |
| 2021 | -153 | 66 | 2 | 21 | 111 | -72 | -9 | 461 | 438 | -634 | 582 | -892 |
| 2022 | -48 | 208 | -209 | 16 | -118 | 7 | 204 | -96 | 994 | -499 | -263 | -318 |
| 2023 | 366 | 98 | -368 | -230 | 178 | 110 | -81 | -45 | 66 | 323 | -361 | -126 |
| 2024 | 116 | |||||||||||
| - = No Data Reported; -- = Not Applicable; NA = Not Available; W = Withheld to avoid disclosure of individual company data. |
| Release Date: 3/29/2024 |
| Next Release Date: 4/30/2024 |
Referring Pages: