|
Download Data (XLS File) |
|
||||||||||
|
||||||||||
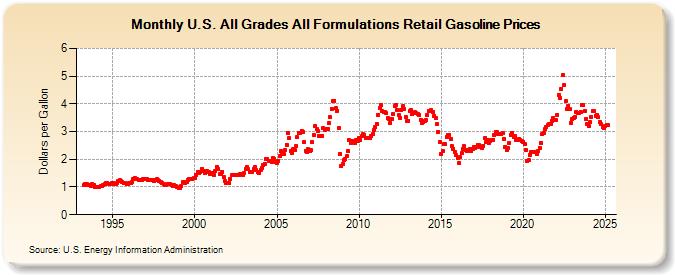
| U.S. All Grades All Formulations Retail Gasoline Prices (Dollars per Gallon) | ||||||||||
| Year | Jan | Feb | Mar | Apr | May | Jun | Jul | Aug | Sep | Oct | Nov | Dec |
|---|---|---|---|---|---|---|---|---|---|---|---|---|
| 1993 | 1.078 | 1.100 | 1.097 | 1.078 | 1.062 | 1.050 | 1.092 | 1.066 | 1.014 | |||
| 1994 | 0.998 | 1.009 | 1.008 | 1.027 | 1.047 | 1.078 | 1.106 | 1.155 | 1.144 | 1.114 | 1.119 | 1.129 |
| 1995 | 1.130 | 1.120 | 1.119 | 1.157 | 1.225 | 1.239 | 1.201 | 1.170 | 1.158 | 1.134 | 1.109 | 1.118 |
| 1996 | 1.137 | 1.136 | 1.183 | 1.275 | 1.324 | 1.300 | 1.272 | 1.251 | 1.247 | 1.249 | 1.278 | 1.282 |
| 1997 | 1.283 | 1.276 | 1.251 | 1.244 | 1.245 | 1.242 | 1.220 | 1.268 | 1.276 | 1.242 | 1.216 | 1.177 |
| 1998 | 1.132 | 1.096 | 1.064 | 1.077 | 1.105 | 1.103 | 1.094 | 1.065 | 1.049 | 1.059 | 1.036 | 0.987 |
| 1999 | 0.980 | 0.962 | 1.022 | 1.171 | 1.171 | 1.154 | 1.197 | 1.260 | 1.295 | 1.285 | 1.292 | 1.313 |
| 2000 | 1.329 | 1.415 | 1.556 | 1.506 | 1.526 | 1.666 | 1.591 | 1.506 | 1.588 | 1.571 | 1.557 | 1.483 |
| 2001 | 1.487 | 1.490 | 1.450 | 1.591 | 1.738 | 1.658 | 1.466 | 1.461 | 1.557 | 1.357 | 1.212 | 1.127 |
| 2002 | 1.148 | 1.155 | 1.289 | 1.439 | 1.434 | 1.424 | 1.438 | 1.438 | 1.441 | 1.486 | 1.461 | 1.429 |
| 2003 | 1.500 | 1.655 | 1.734 | 1.633 | 1.539 | 1.533 | 1.554 | 1.661 | 1.721 | 1.606 | 1.555 | 1.522 |
| 2004 | 1.614 | 1.690 | 1.778 | 1.839 | 2.023 | 2.013 | 1.954 | 1.920 | 1.912 | 2.042 | 2.023 | 1.887 |
| 2005 | 1.875 | 1.953 | 2.120 | 2.285 | 2.205 | 2.198 | 2.333 | 2.529 | 2.951 | 2.765 | 2.303 | 2.229 |
| 2006 | 2.360 | 2.326 | 2.468 | 2.787 | 2.953 | 2.930 | 3.025 | 2.999 | 2.606 | 2.293 | 2.275 | 2.359 |
| 2007 | 2.289 | 2.323 | 2.609 | 2.891 | 3.187 | 3.102 | 3.011 | 2.834 | 2.849 | 2.853 | 3.128 | 3.070 |
| 2008 | 3.095 | 3.078 | 3.293 | 3.507 | 3.815 | 4.105 | 4.114 | 3.833 | 3.756 | 3.112 | 2.208 | 1.745 |
| 2009 | 1.840 | 1.975 | 2.011 | 2.102 | 2.316 | 2.681 | 2.582 | 2.670 | 2.609 | 2.605 | 2.706 | 2.663 |
| 2010 | 2.769 | 2.699 | 2.824 | 2.900 | 2.890 | 2.785 | 2.782 | 2.783 | 2.757 | 2.853 | 2.913 | 3.048 |
| 2011 | 3.148 | 3.264 | 3.615 | 3.852 | 3.960 | 3.735 | 3.705 | 3.696 | 3.667 | 3.506 | 3.443 | 3.326 |
| 2012 | 3.440 | 3.640 | 3.907 | 3.958 | 3.791 | 3.596 | 3.498 | 3.780 | 3.910 | 3.812 | 3.521 | 3.381 |
| 2013 | 3.391 | 3.736 | 3.779 | 3.638 | 3.675 | 3.689 | 3.661 | 3.645 | 3.604 | 3.420 | 3.322 | 3.357 |
| 2014 | 3.392 | 3.434 | 3.606 | 3.735 | 3.750 | 3.766 | 3.688 | 3.565 | 3.484 | 3.255 | 2.997 | 2.632 |
| 2015 | 2.208 | 2.301 | 2.546 | 2.555 | 2.802 | 2.885 | 2.880 | 2.726 | 2.462 | 2.387 | 2.260 | 2.144 |
| 2016 | 2.057 | 1.872 | 2.071 | 2.216 | 2.371 | 2.467 | 2.345 | 2.284 | 2.327 | 2.359 | 2.295 | 2.366 |
| 2017 | 2.458 | 2.416 | 2.437 | 2.528 | 2.503 | 2.460 | 2.414 | 2.494 | 2.761 | 2.621 | 2.678 | 2.594 |
| 2018 | 2.671 | 2.705 | 2.709 | 2.873 | 2.987 | 2.970 | 2.928 | 2.914 | 2.915 | 2.943 | 2.736 | 2.457 |
| 2019 | 2.338 | 2.393 | 2.594 | 2.881 | 2.946 | 2.804 | 2.823 | 2.707 | 2.681 | 2.724 | 2.693 | 2.645 |
| 2020 | 2.636 | 2.533 | 2.329 | 1.938 | 1.961 | 2.170 | 2.272 | 2.272 | 2.274 | 2.248 | 2.200 | 2.284 |
| 2021 | 2.420 | 2.587 | 2.898 | 2.948 | 3.076 | 3.157 | 3.231 | 3.255 | 3.272 | 3.384 | 3.491 | 3.406 |
| 2022 | 3.413 | 3.611 | 4.322 | 4.213 | 4.545 | 5.032 | 4.668 | 4.087 | 3.817 | 3.935 | 3.799 | 3.324 |
| 2023 | 3.445 | 3.501 | 3.535 | 3.711 | 3.666 | 3.684 | 3.712 | 3.954 | 3.958 | 3.742 | 3.443 | 3.257 |
| 2024 | 3.197 | 3.328 | 3.542 | 3.733 | 3.725 | 3.576 | 3.600 | 3.507 | 3.338 | 3.261 | 3.175 | 3.139 |
| 2025 | 3.196 | 3.247 | 3.223 | 3.299 | 3.278 | |||||||
| - = No Data Reported; -- = Not Applicable; NA = Not Available; W = Withheld to avoid disclosure of individual company data. |
| Release Date: 6/24/2025 |
| Next Release Date: 7/1/2025 |