|
Download Data (XLS File) |
|
||||||||
|
||||||||
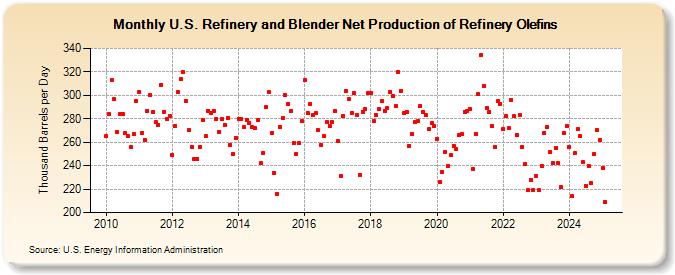
| U.S. Refinery and Blender Net Production of Refinery Olefins (Thousand Barrels per Day) | ||||||||
| Year | Jan | Feb | Mar | Apr | May | Jun | Jul | Aug | Sep | Oct | Nov | Dec |
|---|---|---|---|---|---|---|---|---|---|---|---|---|
| 2010 | 265 | 284 | 313 | 297 | 269 | 284 | 284 | 268 | 265 | 256 | 267 | 295 |
| 2011 | 303 | 268 | 262 | 287 | 300 | 286 | 277 | 275 | 309 | 286 | 280 | 282 |
| 2012 | 249 | 274 | 303 | 314 | 320 | 295 | 270 | 256 | 246 | 246 | 256 | 279 |
| 2013 | 265 | 287 | 285 | 287 | 280 | 269 | 280 | 275 | 281 | 258 | 250 | 264 |
| 2014 | 280 | 280 | 273 | 279 | 276 | 273 | 272 | 279 | 242 | 251 | 290 | 303 |
| 2015 | 268 | 234 | 216 | 273 | 281 | 300 | 293 | 287 | 259 | 250 | 259 | 278 |
| 2016 | 313 | 285 | 293 | 283 | 285 | 270 | 258 | 265 | 277 | 274 | 277 | 287 |
| 2017 | 261 | 231 | 282 | 304 | 297 | 285 | 302 | 283 | 232 | 286 | 288 | 302 |
| 2018 | 302 | 278 | 283 | 288 | 295 | 287 | 289 | 303 | 299 | 291 | 320 | 304 |
| 2019 | 285 | 286 | 257 | 267 | 277 | 278 | 291 | 286 | 283 | 271 | 276 | 274 |
| 2020 | 263 | 226 | 235 | 252 | 240 | 249 | 257 | 254 | 266 | 267 | 286 | 287 |
| 2021 | 288 | 237 | 267 | 301 | 334 | 308 | 289 | 286 | 274 | 256 | 295 | 293 |
| 2022 | 271 | 282 | 272 | 296 | 282 | 266 | 283 | 256 | 241 | 219 | 228 | 219 |
| 2023 | 231 | 219 | 240 | 268 | 273 | 252 | 242 | 255 | 242 | 222 | 268 | 274 |
| 2024 | 256 | 214 | 251 | 271 | 265 | 243 | ||||||
| - = No Data Reported; -- = Not Applicable; NA = Not Available; W = Withheld to avoid disclosure of individual company data. |
| Release Date: 8/30/2024 |
| Next Release Date: 9/30/2024 |