|
Download Data (XLS File) |
|
||||||||
|
||||||||
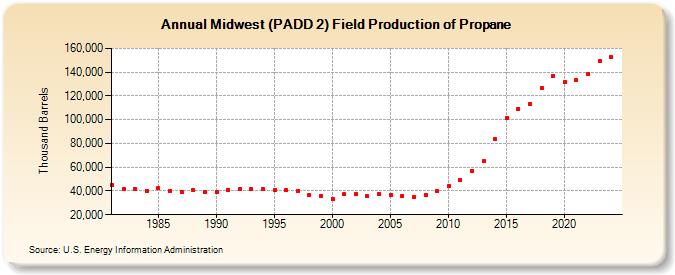
| Midwest (PADD 2) Field Production of Propane (Thousand Barrels) | ||||||||
| Decade | Year-0 | Year-1 | Year-2 | Year-3 | Year-4 | Year-5 | Year-6 | Year-7 | Year-8 | Year-9 |
|---|---|---|---|---|---|---|---|---|---|---|
| 1980's | 44,869 | 41,387 | 41,666 | 40,278 | 42,580 | 39,829 | 39,259 | 40,503 | 38,959 | |
| 1990's | 39,158 | 41,156 | 41,386 | 41,346 | 41,235 | 40,574 | 40,735 | 39,876 | 36,608 | 35,766 |
| 2000's | 33,361 | 37,365 | 37,820 | 35,469 | 37,458 | 36,474 | 36,102 | 34,860 | 36,933 | 40,097 |
| 2010's | 44,230 | 49,386 | 57,022 | 65,144 | 83,768 | 101,202 | 109,303 | 113,496 | 126,924 | 136,991 |
| 2020's | 131,771 | 133,164 | 138,293 | 148,972 |
| - = No Data Reported; -- = Not Applicable; NA = Not Available; W = Withheld to avoid disclosure of individual company data. |
| Release Date: 8/30/2024 |
| Next Release Date: 8/29/2025 |