|
Download Data (XLS File) |
|
||||||||
|
||||||||
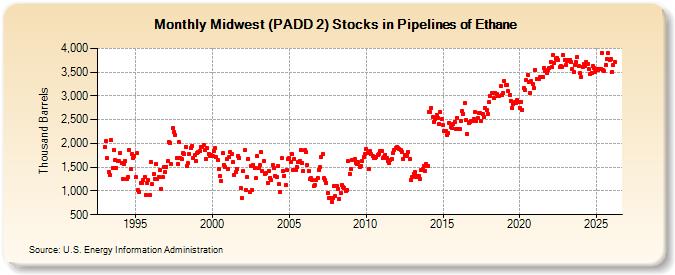
| Midwest (PADD 2) Stocks in Pipelines of Ethane (Thousand Barrels) | ||||||||
| Year | Jan | Feb | Mar | Apr | May | Jun | Jul | Aug | Sep | Oct | Nov | Dec |
|---|---|---|---|---|---|---|---|---|---|---|---|---|
| 1993 | 1,922 | 2,052 | 1,686 | 1,404 | 1,338 | 2,063 | 1,487 | 1,864 | 1,661 | 1,488 | 1,630 | 1,621 |
| 1994 | 1,808 | 1,590 | 1,260 | 1,575 | 1,631 | 1,259 | 1,289 | 1,871 | 1,460 | 1,770 | 1,685 | 1,738 |
| 1995 | 1,287 | 1,791 | 1,010 | 984 | 1,174 | 1,177 | 1,224 | 1,290 | 920 | 1,165 | 1,234 | 919 |
| 1996 | 1,608 | 1,145 | 1,352 | 1,262 | 1,574 | 1,256 | 1,303 | 1,431 | 1,042 | 1,298 | 1,508 | 1,399 |
| 1997 | 1,513 | 1,626 | 2,039 | 2,012 | 1,559 | 2,315 | 2,243 | 2,181 | 1,691 | 1,572 | 2,022 | 1,702 |
| 1998 | 1,662 | 1,801 | 1,773 | 1,935 | 1,526 | 1,582 | 1,770 | 1,902 | 1,944 | 1,703 | 1,749 | 1,628 |
| 1999 | 1,809 | 1,812 | 1,845 | 1,932 | 1,935 | 1,976 | 1,871 | 1,680 | 1,907 | 1,783 | 1,728 | 1,766 |
| 2000 | 1,729 | 1,834 | 1,906 | 1,711 | 1,656 | 1,452 | 1,315 | 1,214 | 1,792 | 1,537 | 1,502 | 1,671 |
| 2001 | 1,461 | 1,705 | 1,824 | 1,775 | 1,599 | 1,338 | 1,406 | 1,470 | 1,738 | 1,697 | 1,065 | 855 |
| 2002 | 1,418 | 1,856 | 1,026 | 1,296 | 1,681 | 986 | 1,522 | 1,024 | 1,546 | 1,476 | 1,266 | 1,728 |
| 2003 | 1,476 | 1,545 | 1,810 | 1,425 | 1,634 | 1,367 | 1,388 | 1,171 | 1,421 | 1,282 | 1,223 | 1,551 |
| 2004 | 1,476 | 1,323 | 1,299 | 1,527 | 1,136 | 974 | 1,687 | 1,416 | 1,319 | 1,123 | 1,443 | 1,670 |
| 2005 | 1,693 | 1,614 | 1,773 | 1,443 | 1,679 | 1,440 | 1,504 | 1,601 | 1,639 | 1,856 | 1,590 | 1,417 |
| 2006 | 1,855 | 1,811 | 1,550 | 1,421 | 1,244 | 1,265 | 1,234 | 1,098 | 1,124 | 1,234 | 1,276 | 1,442 |
| 2007 | 1,496 | 1,709 | 1,768 | 1,269 | 1,235 | 1,176 | 952 | 857 | 850 | 774 | 852 | 1,109 |
| 2008 | 887 | 1,097 | 1,050 | 838 | 963 | 1,127 | 1,084 | 1,066 | 1,004 | 1,024 | 1,620 | 1,358 |
| 2009 | 1,471 | 1,657 | 1,651 | 1,671 | 1,596 | 1,573 | 1,606 | 1,505 | 1,525 | 1,634 | 1,716 | 1,782 |
| 2010 | 1,881 | 1,802 | 1,456 | 1,834 | 1,776 | 1,735 | 1,692 | 1,688 | 1,723 | 1,762 | 1,784 | 1,848 |
| 2011 | 1,846 | 1,685 | 1,714 | 1,759 | 1,688 | 1,635 | 1,578 | 1,652 | 1,682 | 1,802 | 1,852 | 1,903 |
| 2012 | 1,915 | 1,904 | 1,893 | 1,861 | 1,828 | 1,667 | 1,748 | 1,729 | 1,766 | 1,824 | 1,682 | 1,223 |
| 2013 | 1,287 | 1,364 | 1,402 | 1,304 | 1,309 | 1,310 | 1,262 | 1,431 | 1,465 | 1,522 | 1,418 | 1,562 |
| 2014 | 1,521 | 2,664 | 2,655 | 2,753 | 2,548 | 2,451 | 2,509 | 2,605 | 2,538 | 2,411 | 2,660 | 2,518 |
| 2015 | 2,379 | 2,255 | 2,255 | 2,168 | 2,215 | 2,439 | 2,347 | 2,320 | 2,413 | 2,451 | 2,303 | 2,545 |
| 2016 | 2,305 | 2,300 | 2,463 | 2,687 | 2,628 | 2,853 | 2,491 | 2,195 | 2,434 | 2,455 | 2,469 | 2,472 |
| 2017 | 2,523 | 2,660 | 2,464 | 2,539 | 2,648 | 2,632 | 2,475 | 2,619 | 2,566 | 2,756 | 2,702 | 2,625 |
| 2018 | 2,868 | 3,003 | 3,053 | 3,052 | 2,950 | 3,056 | 3,038 | 2,988 | 2,993 | 3,204 | 3,026 | 3,063 |
| 2019 | 3,314 | 3,227 | 3,240 | 3,103 | 3,025 | 2,898 | 2,752 | 2,821 | 2,862 | 2,854 | 2,920 | 2,877 |
| 2020 | 2,746 | 2,879 | 2,710 | 3,157 | 3,129 | 3,340 | 3,448 | 3,295 | 3,069 | 3,310 | 3,261 | 3,169 |
| 2021 | 3,549 | 3,363 | 3,347 | 3,361 | 3,389 | 3,390 | 3,388 | 3,587 | 3,525 | 3,486 | 3,544 | 3,582 |
| 2022 | 3,721 | 3,600 | 3,861 | 3,684 | 3,786 | 3,798 | 3,762 | 3,598 | 3,628 | 3,618 | 3,859 | 3,757 |
| 2023 | 3,658 | 3,728 | 3,767 | 3,760 | 3,715 | 3,560 | 3,513 | 3,655 | 3,712 | 3,814 | 3,625 | 3,473 |
| 2024 | 3,404 | 3,605 | 3,614 | 3,634 | ||||||||
| - = No Data Reported; -- = Not Applicable; NA = Not Available; W = Withheld to avoid disclosure of individual company data. |
| Release Date: 6/28/2024 |
| Next Release Date: 7/31/2024 |