|
Download Data (XLS File) |
|
||||||||
|
||||||||
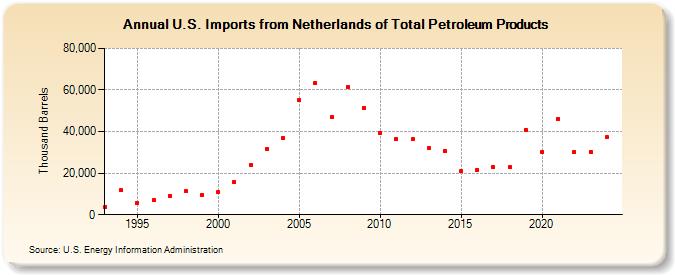
| U.S. Imports from Netherlands of Total Petroleum Products (Thousand Barrels) | ||||||||
| Decade | Year-0 | Year-1 | Year-2 | Year-3 | Year-4 | Year-5 | Year-6 | Year-7 | Year-8 | Year-9 |
|---|---|---|---|---|---|---|---|---|---|---|
| 1990's | 3,807 | 11,755 | 5,584 | 7,100 | 9,005 | 11,197 | 9,710 | |||
| 2000's | 10,728 | 15,729 | 23,961 | 31,660 | 36,955 | 55,076 | 63,390 | 46,857 | 61,533 | 51,251 |
| 2010's | 39,241 | 36,392 | 36,251 | 31,939 | 30,722 | 20,814 | 21,579 | 22,801 | 22,811 | 40,825 |
| 2020's | 30,156 | 46,131 | 30,277 | 30,456 |
| - = No Data Reported; -- = Not Applicable; NA = Not Available; W = Withheld to avoid disclosure of individual company data. |
| Release Date: 3/29/2024 |
| Next Release Date: 8/30/2024 |