|
Download Data (XLS File) |
|
||||||||
|
||||||||
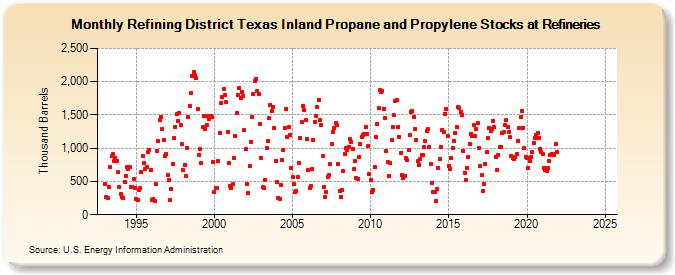
| Refining District Texas Inland Propane and Propylene Stocks at Refineries (Thousand Barrels) | ||||||||
| Year | Jan | Feb | Mar | Apr | May | Jun | Jul | Aug | Sep | Oct | Nov | Dec |
|---|---|---|---|---|---|---|---|---|---|---|---|---|
| 1993 | 463 | 272 | 258 | 413 | 714 | 882 | 916 | 814 | 859 | 814 | 641 | 416 |
| 1994 | 307 | 266 | 246 | 496 | 588 | 711 | 685 | 713 | 415 | 423 | 535 | 406 |
| 1995 | 231 | 223 | 365 | 397 | 640 | 886 | 781 | 693 | 716 | 949 | 969 | 671 |
| 1996 | 222 | 234 | 209 | 460 | 957 | 1,102 | 1,428 | 1,467 | 1,294 | 1,126 | 887 | 908 |
| 1997 | 591 | 522 | 220 | 390 | 769 | 1,157 | 1,323 | 1,508 | 1,412 | 1,523 | 1,349 | 1,059 |
| 1998 | 675 | 750 | 576 | 1,005 | 1,463 | 1,633 | 1,826 | 2,082 | 2,138 | 2,098 | 2,053 | 1,585 |
| 1999 | 904 | 981 | 772 | 1,320 | 1,479 | 1,293 | 1,356 | 1,486 | 1,440 | 1,491 | 1,462 | 795 |
| 2000 | 342 | 396 | 399 | 806 | 1,227 | 1,678 | 1,770 | 1,884 | 1,795 | 1,697 | 1,243 | 773 |
| 2001 | 432 | 399 | 462 | 854 | 1,185 | 1,532 | 1,794 | 1,908 | 1,750 | 1,840 | 1,777 | 1,266 |
| 2002 | 985 | 465 | 330 | 729 | 1,091 | 1,469 | 1,816 | 2,014 | 2,041 | 1,855 | 1,819 | 1,364 |
| 2003 | 859 | 411 | 403 | 524 | 996 | 1,112 | 1,455 | 1,655 | 1,554 | 1,622 | 1,305 | 807 |
| 2004 | 495 | 251 | 235 | 447 | 823 | 974 | 1,308 | 1,586 | 1,163 | 1,312 | 1,198 | 708 |
| 2005 | 560 | 456 | 334 | 352 | 568 | 782 | 1,154 | 1,389 | 1,637 | 1,581 | 1,421 | 1,139 |
| 2006 | 665 | 408 | 435 | 692 | 1,124 | 1,399 | 1,484 | 1,613 | 1,725 | 1,418 | 1,356 | 885 |
| 2007 | 422 | 272 | 338 | 568 | 591 | 755 | 1,059 | 1,250 | 1,305 | 1,386 | 1,355 | 764 |
| 2008 | 354 | 269 | 378 | 653 | 915 | 999 | 977 | 1,022 | 1,138 | 1,091 | 984 | 685 |
| 2009 | 807 | 553 | 530 | 871 | 1,056 | 1,172 | 1,200 | 1,208 | 1,317 | 1,220 | 1,036 | 607 |
| 2010 | 528 | 339 | 372 | 715 | 1,168 | 1,369 | 1,604 | 1,875 | 1,850 | 1,858 | 1,591 | 1,452 |
| 2011 | 953 | 799 | 576 | 770 | 1,119 | 1,324 | 1,493 | 1,716 | 1,722 | 1,319 | 1,174 | 926 |
| 2012 | 591 | 552 | 578 | 853 | 819 | 978 | 1,201 | 1,547 | 1,553 | 1,475 | 1,295 | 1,128 |
| 2013 | 807 | 752 | 830 | 891 | 900 | 1,013 | 1,101 | 1,258 | 1,282 | 1,023 | 764 | 477 |
| 2014 | 338 | 340 | 205 | 387 | 699 | 834 | 1,011 | 1,280 | 1,240 | 1,521 | 1,594 | 1,190 |
| 2015 | 738 | 691 | 851 | 1,010 | 1,104 | 1,225 | 1,318 | 1,619 | 1,598 | 1,541 | 1,500 | 956 |
| 2016 | 629 | 516 | 706 | 865 | 1,065 | 1,217 | 1,186 | 1,344 | 1,178 | 1,287 | 1,386 | 1,005 |
| 2017 | 732 | 592 | 349 | 456 | 769 | 941 | 1,149 | 1,304 | 1,260 | 1,291 | 1,413 | 1,314 |
| 2018 | 874 | 678 | 902 | 1,019 | 1,020 | 1,232 | 1,239 | 1,343 | 1,423 | 1,320 | 1,237 | 1,165 |
| 2019 | 879 | 856 | 832 | 873 | 919 | 1,111 | 1,309 | 1,466 | 1,559 | 1,300 | 1,010 | 870 |
| 2020 | 849 | 704 | 804 | 867 | 944 | 1,079 | 1,155 | 1,202 | 1,225 | 1,159 | 985 | 949 |
| 2021 | 906 | 707 | 668 | 660 | 705 | 801 | 893 | 918 | 913 | 901 | 1,058 | 948 |
| 2022 | -- | -- | -- | -- | -- | -- | -- | -- | -- | -- | -- | -- |
| 2023 | -- | -- | -- | -- | -- | -- | -- | -- | -- | -- | -- | -- |
| 2024 | -- | -- | -- | -- | ||||||||
| - = No Data Reported; -- = Not Applicable; NA = Not Available; W = Withheld to avoid disclosure of individual company data. |
| Release Date: 6/28/2024 |
| Next Release Date: 7/31/2024 |
Referring Pages: