|
Download Data (XLS File) |
|
||||||||
|
||||||||
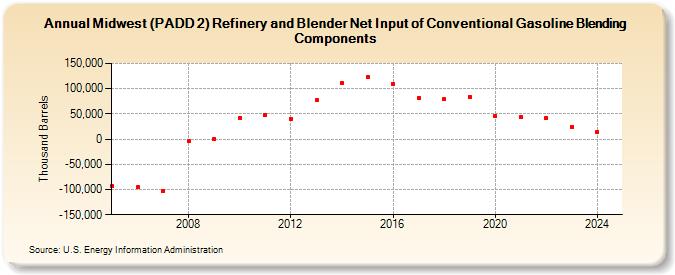
| Midwest (PADD 2) Refinery and Blender Net Input of Conventional Gasoline Blending Components (Thousand Barrels) | ||||||||
| Decade | Year-0 | Year-1 | Year-2 | Year-3 | Year-4 | Year-5 | Year-6 | Year-7 | Year-8 | Year-9 |
|---|---|---|---|---|---|---|---|---|---|---|
| 2000's | -93,080 | -95,457 | -102,341 | -4,523 | 264 | |||||
| 2010's | 42,521 | 48,727 | 40,847 | 76,995 | 111,771 | 123,328 | 110,085 | 81,410 | 78,906 | 84,200 |
| 2020's | 46,559 | 43,453 | 41,464 | 24,497 |
| - = No Data Reported; -- = Not Applicable; NA = Not Available; W = Withheld to avoid disclosure of individual company data. |
| Release Date: 3/29/2024 |
| Next Release Date: 8/30/2024 |