|
Download Data (XLS File) |
|
||||||||
|
||||||||
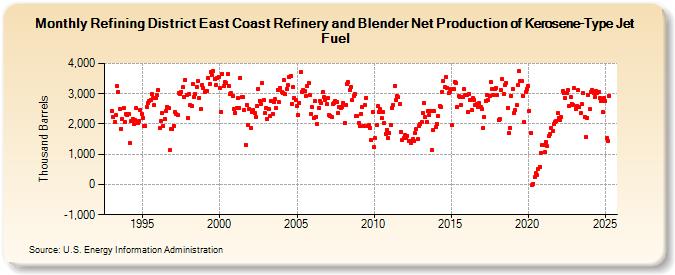
| Refining District East Coast Refinery and Blender Net Production of Kerosene-Type Jet Fuel (Thousand Barrels) | ||||||||
| Year | Jan | Feb | Mar | Apr | May | Jun | Jul | Aug | Sep | Oct | Nov | Dec |
|---|---|---|---|---|---|---|---|---|---|---|---|---|
| 1993 | 2,443 | 2,230 | 2,069 | 2,291 | 3,243 | 3,062 | 2,479 | 1,846 | 2,160 | 2,528 | 2,072 | 2,343 |
| 1994 | 2,304 | 2,321 | 1,373 | 2,086 | 2,176 | 1,983 | 2,139 | 2,521 | 2,020 | 2,107 | 2,474 | 2,325 |
| 1995 | 2,212 | 1,937 | 1,927 | 2,556 | 2,683 | 2,775 | 2,805 | 2,985 | 2,852 | 2,618 | 2,856 | 2,959 |
| 1996 | 3,125 | 1,852 | 2,084 | 2,358 | 1,942 | 2,163 | 2,422 | 2,572 | 2,517 | 1,126 | 1,849 | 1,842 |
| 1997 | 1,937 | 2,400 | 2,330 | 2,293 | 3,016 | 2,990 | 3,058 | 3,206 | 2,886 | 3,466 | 2,961 | 2,192 |
| 1998 | 2,995 | 2,622 | 2,606 | 3,323 | 2,898 | 2,994 | 3,226 | 3,426 | 2,860 | 2,497 | 3,283 | 3,193 |
| 1999 | 3,055 | 3,101 | 3,098 | 3,513 | 3,321 | 3,716 | 3,607 | 3,751 | 3,492 | 3,295 | 3,526 | 3,559 |
| 2000 | 3,185 | 2,403 | 3,663 | 3,239 | 3,382 | 3,368 | 3,638 | 3,270 | 2,996 | 3,010 | 2,926 | 2,488 |
| 2001 | 2,375 | 2,520 | 2,845 | 2,529 | 3,531 | 2,888 | 2,886 | 2,465 | 1,314 | 2,638 | 1,955 | 2,506 |
| 2002 | 1,862 | 2,412 | 2,467 | 2,357 | 2,246 | 2,588 | 3,158 | 2,776 | 2,668 | 3,348 | 2,791 | 2,360 |
| 2003 | 2,532 | 2,158 | 2,481 | 2,256 | 2,774 | 2,338 | 2,724 | 2,817 | 2,525 | 3,138 | 2,717 | 3,184 |
| 2004 | 3,060 | 3,018 | 3,442 | 2,976 | 3,149 | 3,274 | 3,547 | 3,598 | 2,669 | 3,210 | 2,856 | 2,780 |
| 2005 | 2,596 | 2,293 | 2,704 | 3,717 | 3,057 | 3,132 | 3,080 | 2,911 | 3,251 | 3,341 | 2,949 | 2,343 |
| 2006 | 2,547 | 2,187 | 2,761 | 2,247 | 2,015 | 2,531 | 2,760 | 2,679 | 3,066 | 2,892 | 2,793 | 2,645 |
| 2007 | 2,843 | 2,285 | 2,276 | 2,215 | 2,673 | 2,689 | 2,761 | 2,723 | 2,375 | 2,573 | 2,523 | 2,565 |
| 2008 | 2,696 | 2,029 | 2,639 | 3,322 | 3,384 | 3,111 | 3,223 | 2,779 | 2,941 | 3,004 | 2,251 | 2,255 |
| 2009 | 2,044 | 1,929 | 2,340 | 2,572 | 1,947 | 2,612 | 2,868 | 1,925 | 1,964 | 1,872 | 1,475 | 2,406 |
| 2010 | 1,228 | 1,524 | 1,956 | 2,580 | 2,399 | 2,487 | 2,209 | 2,391 | 2,025 | 1,682 | 1,813 | 1,534 |
| 2011 | 1,695 | 1,965 | 2,535 | 2,638 | 3,271 | 2,791 | 2,933 | 2,879 | 2,651 | 1,750 | 1,478 | 1,535 |
| 2012 | 1,622 | 1,536 | 1,607 | 1,449 | 1,438 | 1,376 | 1,494 | 1,444 | 1,691 | 1,832 | 1,497 | 1,929 |
| 2013 | 2,010 | 2,057 | 2,373 | 2,678 | 2,218 | 2,077 | 2,418 | 2,285 | 2,416 | 1,138 | 1,797 | 2,419 |
| 2014 | 1,897 | 1,994 | 2,266 | 2,600 | 2,550 | 3,069 | 3,431 | 3,206 | 3,565 | 3,198 | 3,015 | 3,045 |
| 2015 | 3,151 | 1,963 | 3,141 | 3,390 | 3,356 | 2,557 | 2,919 | 2,877 | 2,620 | 2,906 | 3,163 | 2,942 |
| 2016 | 2,948 | 2,404 | 2,992 | 2,790 | 2,467 | 2,856 | 2,803 | 2,616 | 2,655 | 2,577 | 2,691 | 2,567 |
| 2017 | 2,497 | 1,882 | 2,232 | 2,768 | 2,948 | 2,779 | 2,916 | 3,377 | 3,150 | 2,952 | 3,149 | 3,190 |
| 2018 | 2,946 | 2,126 | 2,164 | 3,107 | 3,484 | 2,990 | 3,273 | 3,357 | 2,535 | 1,689 | 1,883 | 2,935 |
| 2019 | 3,168 | 2,370 | 2,454 | 2,625 | 3,279 | 3,743 | 3,437 | 3,419 | 2,935 | 2,067 | 3,060 | 3,158 |
| 2020 | 3,266 | 2,441 | 1,708 | -31 | 24 | 243 | 364 | 305 | 526 | 592 | 1,041 | 1,309 |
| 2021 | 1,314 | 1,073 | 1,415 | 1,263 | 1,591 | 1,671 | 1,874 | 1,763 | 1,997 | 2,077 | 2,083 | 2,362 |
| 2022 | 2,206 | 2,118 | 2,217 | 3,090 | 3,038 | 2,849 | 3,009 | 3,129 | 2,595 | 2,886 | 2,675 | 2,635 |
| 2023 | 3,176 | 2,503 | 2,609 | 3,112 | 2,550 | 2,355 | 2,644 | 3,028 | 2,235 | 1,568 | 2,206 | 2,968 |
| 2024 | 2,481 | |||||||||||
| - = No Data Reported; -- = Not Applicable; NA = Not Available; W = Withheld to avoid disclosure of individual company data. |
| Release Date: 3/29/2024 |
| Next Release Date: 4/30/2024 |