|
Download Data (XLS File) |
|
||||||||
|
||||||||
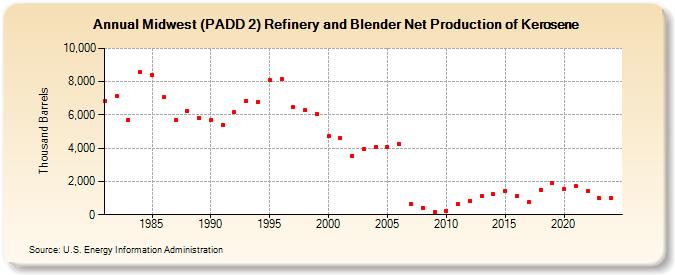
| Midwest (PADD 2) Refinery and Blender Net Production of Kerosene (Thousand Barrels) | ||||||||
| Decade | Year-0 | Year-1 | Year-2 | Year-3 | Year-4 | Year-5 | Year-6 | Year-7 | Year-8 | Year-9 |
|---|---|---|---|---|---|---|---|---|---|---|
| 1980's | 6,809 | 7,146 | 5,711 | 8,604 | 8,373 | 7,086 | 5,691 | 6,254 | 5,840 | |
| 1990's | 5,700 | 5,422 | 6,165 | 6,842 | 6,779 | 8,121 | 8,153 | 6,488 | 6,275 | 6,041 |
| 2000's | 4,712 | 4,630 | 3,516 | 3,955 | 4,078 | 4,062 | 4,271 | 661 | 423 | 172 |
| 2010's | 242 | 644 | 848 | 1,111 | 1,222 | 1,427 | 1,114 | 743 | 1,508 | 1,935 |
| 2020's | 1,525 | 1,724 | 1,422 | 977 | 1,001 |
| - = No Data Reported; -- = Not Applicable; NA = Not Available; W = Withheld to avoid disclosure of individual company data. |
| Release Date: 6/30/2025 |
| Next Release Date: 8/29/2025 |