|
Download Data (XLS File) |
|
||||||||
|
||||||||
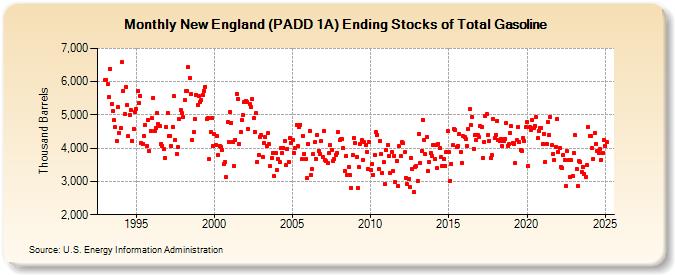
| New England (PADD 1A) Ending Stocks of Total Gasoline (Thousand Barrels) | ||||||||
| Year | Jan | Feb | Mar | Apr | May | Jun | Jul | Aug | Sep | Oct | Nov | Dec |
|---|---|---|---|---|---|---|---|---|---|---|---|---|
| 1993 | 6,036 | 6,063 | 5,918 | 5,524 | 6,395 | 5,318 | 5,123 | 4,834 | 4,628 | 4,205 | 5,233 | 4,468 |
| 1994 | 4,606 | 6,582 | 5,723 | 5,025 | 5,852 | 5,309 | 4,362 | 5,000 | 5,134 | 4,223 | 4,591 | 5,101 |
| 1995 | 5,191 | 5,722 | 5,358 | 5,577 | 4,152 | 4,131 | 4,353 | 4,700 | 4,078 | 4,857 | 3,917 | 4,519 |
| 1996 | 4,913 | 5,520 | 4,519 | 4,619 | 5,059 | 4,721 | 4,661 | 4,128 | 4,067 | 3,976 | 3,710 | 4,635 |
| 1997 | 5,070 | 4,354 | 4,370 | 4,065 | 4,645 | 5,560 | 4,246 | 3,827 | 4,027 | 4,874 | 5,156 | 5,044 |
| 1998 | 4,926 | 5,446 | 5,709 | 5,727 | 6,436 | 6,123 | 5,627 | 4,254 | 4,483 | 4,877 | 5,610 | 5,290 |
| 1999 | 5,562 | 5,397 | 5,444 | 5,610 | 5,723 | 5,853 | 4,868 | 4,898 | 3,666 | 4,488 | 4,919 | 4,064 |
| 2000 | 4,420 | 4,096 | 4,357 | 3,793 | 4,077 | 4,042 | 3,941 | 3,510 | 3,583 | 3,119 | 4,791 | 4,179 |
| 2001 | 5,090 | 4,769 | 4,200 | 3,459 | 4,254 | 5,643 | 5,488 | 4,136 | 4,477 | 4,850 | 4,996 | 5,387 |
| 2002 | 5,430 | 5,382 | 4,578 | 5,329 | 5,253 | 5,473 | 4,897 | 4,498 | 5,064 | 3,595 | 3,796 | 4,347 |
| 2003 | 4,397 | 3,737 | 4,154 | 4,347 | 4,069 | 4,443 | 4,111 | 3,459 | 3,714 | 3,869 | 3,152 | 3,861 |
| 2004 | 3,330 | 3,670 | 3,579 | 3,995 | 3,868 | 4,015 | 4,217 | 3,489 | 3,985 | 3,589 | 4,311 | 4,156 |
| 2005 | 4,242 | 3,866 | 4,008 | 4,697 | 4,055 | 4,635 | 4,712 | 3,667 | 4,374 | 3,839 | 3,665 | 3,098 |
| 2006 | 4,133 | 4,524 | 3,202 | 3,368 | 3,822 | 4,176 | 3,689 | 4,408 | 3,910 | 3,834 | 4,207 | 3,745 |
| 2007 | 4,524 | 3,639 | 3,602 | 3,544 | 3,853 | 4,099 | 3,936 | 3,620 | 3,681 | 3,801 | 3,861 | 4,473 |
| 2008 | 4,249 | 4,275 | 4,270 | 3,996 | 3,303 | 3,767 | 3,197 | 3,446 | 3,196 | 2,814 | 3,789 | 4,301 |
| 2009 | 4,150 | 3,733 | 2,797 | 3,422 | 4,134 | 4,235 | 3,654 | 4,176 | 4,103 | 3,890 | 3,388 | 4,181 |
| 2010 | 3,352 | 3,512 | 3,189 | 3,799 | 4,479 | 4,401 | 3,366 | 4,223 | 3,818 | 3,255 | 3,572 | 2,911 |
| 2011 | 3,958 | 4,110 | 3,780 | 3,250 | 3,881 | 3,306 | 3,769 | 2,990 | 3,616 | 2,871 | 4,054 | 3,770 |
| 2012 | 4,178 | 4,148 | 3,874 | 3,113 | 2,910 | 3,078 | 2,832 | 3,717 | 3,380 | 2,687 | 3,433 | 3,467 |
| 2013 | 3,008 | 4,433 | 3,558 | 3,910 | 4,862 | 4,258 | 3,811 | 4,333 | 3,312 | 3,586 | 3,860 | 3,778 |
| 2014 | 4,089 | 3,677 | 4,102 | 3,390 | 4,137 | 3,992 | 3,721 | 3,467 | 3,663 | 3,472 | 3,884 | 4,508 |
| 2015 | 3,875 | 3,006 | 3,539 | 4,089 | 4,572 | 4,553 | 4,027 | 4,064 | 4,439 | 3,874 | 3,557 | 4,358 |
| 2016 | 4,330 | 4,262 | 4,066 | 4,584 | 5,169 | 4,694 | 4,948 | 3,984 | 4,385 | 4,243 | 4,411 | 4,327 |
| 2017 | 4,663 | 4,630 | 3,710 | 4,195 | 4,967 | 5,019 | 4,404 | 4,227 | 3,705 | 3,781 | 4,869 | 4,299 |
| 2018 | 4,411 | 4,825 | 4,232 | 4,215 | 4,290 | 4,054 | 4,207 | 4,289 | 4,761 | 4,078 | 4,113 | 4,457 |
| 2019 | 4,654 | 4,166 | 4,129 | 3,556 | 4,236 | 4,633 | 4,190 | 3,941 | 3,926 | 4,302 | 4,215 | 4,637 |
| 2020 | 4,786 | 3,462 | 4,623 | 4,560 | 4,849 | 4,614 | 4,677 | 4,931 | 4,293 | 4,511 | 4,601 | 4,610 |
| 2021 | 4,111 | 4,437 | 3,591 | 4,136 | 4,776 | 4,395 | 4,943 | 4,081 | 3,827 | 3,646 | 4,050 | 4,877 |
| 2022 | 3,893 | 4,009 | 3,445 | 3,404 | 3,800 | 3,631 | 2,865 | 3,908 | 3,652 | 3,146 | 3,635 | 3,169 |
| 2023 | 3,840 | 4,185 | 3,380 | 2,869 | 3,602 | 3,588 | 3,285 | 3,439 | 3,236 | 3,134 | 3,486 | 4,639 |
| 2024 | 4,379 | 4,354 | 4,002 | 3,668 | ||||||||
| - = No Data Reported; -- = Not Applicable; NA = Not Available; W = Withheld to avoid disclosure of individual company data. |
| Release Date: 6/28/2024 |
| Next Release Date: 7/31/2024 |