|
Download Data (XLS File) |
|
||||||||
|
||||||||
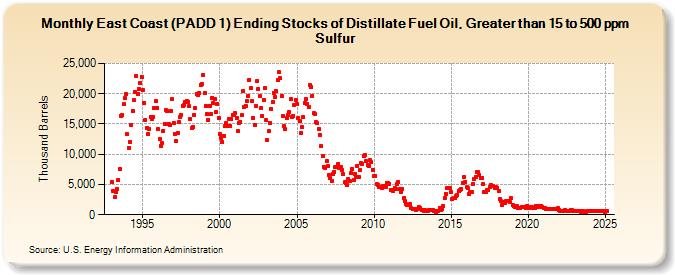
| East Coast (PADD 1) Ending Stocks of Distillate Fuel Oil, Greater than 15 to 500 ppm Sulfur (Thousand Barrels) | ||||||||
| Year | Jan | Feb | Mar | Apr | May | Jun | Jul | Aug | Sep | Oct | Nov | Dec |
|---|---|---|---|---|---|---|---|---|---|---|---|---|
| 1993 | 5,415 | 3,933 | 2,892 | 3,696 | 4,288 | 5,703 | 7,554 | 16,387 | 16,481 | 18,244 | 19,267 | 19,928 |
| 1994 | 13,310 | 11,058 | 12,062 | 14,881 | 17,117 | 18,881 | 20,363 | 22,857 | 19,950 | 20,828 | 21,788 | 22,820 |
| 1995 | 20,697 | 18,428 | 15,592 | 14,254 | 13,325 | 14,237 | 16,166 | 15,853 | 16,126 | 17,621 | 18,787 | 17,622 |
| 1996 | 14,125 | 12,448 | 11,363 | 11,831 | 13,895 | 14,988 | 17,305 | 17,146 | 15,037 | 14,850 | 17,154 | 19,079 |
| 1997 | 15,216 | 13,400 | 12,201 | 13,517 | 15,268 | 16,138 | 16,554 | 18,040 | 18,143 | 18,694 | 18,840 | 18,663 |
| 1998 | 17,927 | 15,787 | 14,288 | 14,553 | 16,526 | 17,621 | 19,912 | 19,831 | 20,113 | 21,443 | 21,643 | 23,168 |
| 1999 | 20,060 | 18,053 | 16,628 | 15,719 | 18,019 | 16,611 | 19,358 | 18,441 | 19,140 | 17,047 | 18,384 | 16,063 |
| 2000 | 13,321 | 12,757 | 12,042 | 13,067 | 14,637 | 15,099 | 14,594 | 15,863 | 14,721 | 15,794 | 16,543 | 16,504 |
| 2001 | 16,732 | 15,958 | 13,849 | 15,124 | 15,385 | 16,456 | 20,506 | 17,884 | 18,054 | 18,739 | 19,695 | 22,320 |
| 2002 | 20,938 | 18,731 | 15,947 | 14,870 | 18,032 | 22,120 | 20,828 | 19,579 | 17,660 | 16,374 | 19,015 | 20,985 |
| 2003 | 15,596 | 12,306 | 13,816 | 15,223 | 17,525 | 18,636 | 20,181 | 19,432 | 20,396 | 22,272 | 23,530 | 22,598 |
| 2004 | 19,697 | 16,351 | 14,623 | 14,125 | 15,995 | 16,402 | 16,946 | 19,106 | 16,209 | 16,292 | 18,164 | 18,885 |
| 2005 | 18,261 | 15,923 | 15,491 | 13,450 | 14,467 | 16,093 | 18,475 | 19,063 | 18,289 | 17,829 | 21,498 | 21,163 |
| 2006 | 19,707 | 16,750 | 16,676 | 15,309 | 15,095 | 14,242 | 13,187 | 11,299 | 9,635 | 7,969 | 7,777 | 8,867 |
| 2007 | 8,000 | 6,497 | 6,010 | 5,518 | 6,735 | 7,131 | 7,962 | 7,856 | 8,439 | 7,745 | 7,861 | 7,427 |
| 2008 | 6,671 | 5,338 | 5,191 | 4,879 | 5,879 | 5,617 | 6,831 | 7,570 | 5,720 | 6,704 | 6,300 | 8,076 |
| 2009 | 6,237 | 7,316 | 8,491 | 8,442 | 9,718 | 9,864 | 8,901 | 8,180 | 8,120 | 8,994 | 8,650 | 7,444 |
| 2010 | 6,323 | 6,478 | 5,115 | 4,924 | 4,569 | 4,588 | 4,498 | 4,698 | 4,820 | 4,613 | 5,293 | 5,207 |
| 2011 | 5,155 | 4,070 | 4,003 | 3,839 | 4,495 | 4,200 | 5,105 | 5,372 | 4,218 | 3,821 | 4,250 | 2,740 |
| 2012 | 2,212 | 1,695 | 1,665 | 1,611 | 1,753 | 1,106 | 956 | 876 | 899 | 735 | 943 | 1,211 |
| 2013 | 1,037 | 845 | 761 | 687 | 712 | 684 | 643 | 807 | 717 | 768 | 708 | 658 |
| 2014 | 435 | 654 | 683 | 1,033 | 704 | 941 | 1,425 | 2,824 | 3,457 | 4,481 | 4,379 | 4,394 |
| 2015 | 3,715 | 2,623 | 2,682 | 2,739 | 3,128 | 3,256 | 3,851 | 4,042 | 4,200 | 5,293 | 6,197 | 5,476 |
| 2016 | 4,544 | 4,357 | 3,458 | 3,673 | 3,812 | 5,014 | 5,951 | 6,308 | 7,070 | 7,075 | 6,604 | 6,007 |
| 2017 | 6,148 | 5,030 | 3,727 | 3,793 | 4,030 | 4,140 | 4,535 | 4,978 | 4,669 | 4,712 | 4,462 | 4,503 |
| 2018 | 4,458 | 3,992 | 2,574 | 2,242 | 1,638 | 2,133 | 1,917 | 2,314 | 2,205 | 2,289 | 2,021 | 2,692 |
| 2019 | 1,594 | 1,372 | 1,342 | 1,397 | 1,192 | 1,176 | 1,105 | 1,301 | 1,260 | 1,336 | 1,174 | 1,400 |
| 2020 | 1,277 | 1,147 | 1,223 | 1,298 | 1,112 | 1,072 | 1,435 | 1,409 | 1,291 | 1,437 | 1,453 | 1,346 |
| 2021 | 1,055 | 1,154 | 1,014 | 960 | 957 | 1,004 | 996 | 896 | 877 | 942 | 873 | 1,035 |
| 2022 | 841 | 642 | 650 | 576 | 581 | 751 | 629 | 620 | 676 | 785 | 714 | 591 |
| 2023 | 598 | 580 | 623 | 589 | 637 | 512 | 534 | 568 | 508 | 530 | 603 | 552 |
| 2024 | 536 | 604 | 621 | 556 | ||||||||
| - = No Data Reported; -- = Not Applicable; NA = Not Available; W = Withheld to avoid disclosure of individual company data. |
| Release Date: 6/28/2024 |
| Next Release Date: 7/31/2024 |