|
Download Data (XLS File) |
|
||||||||
|
||||||||
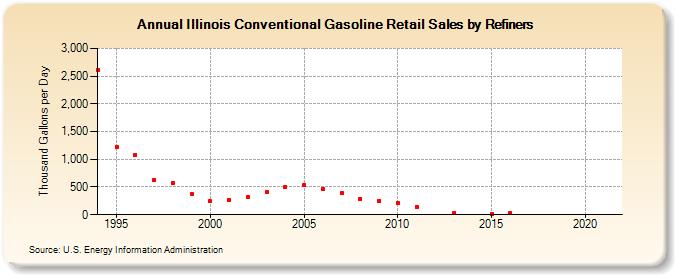
| Illinois Conventional Gasoline Retail Sales by Refiners (Thousand Gallons per Day) | ||||||||
| Decade | Year-0 | Year-1 | Year-2 | Year-3 | Year-4 | Year-5 | Year-6 | Year-7 | Year-8 | Year-9 |
|---|---|---|---|---|---|---|---|---|---|---|
| 1990's | 2,617.3 | 1,221.0 | 1,085.4 | 623.4 | 579.9 | 374.6 | ||||
| 2000's | 240.7 | 272.6 | 322.7 | 411.1 | 508.3 | 531.6 | 468.0 | 390.9 | 291.5 | 254.8 |
| 2010's | 212.1 | 145.9 | W | 39.1 | W | 17.0 | 31.9 | W | W | W |
| 2020's | W |
| - = No Data Reported; -- = Not Applicable; NA = Not Available; W = Withheld to avoid disclosure of individual company data. |
| Release Date: 6/1/2022 |
| Next Release Date: TBD |