|
Download Data (XLS File) |
|
|||||
|
|||||
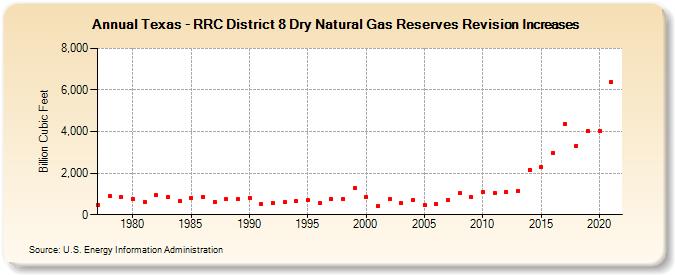
| Texas - RRC District 8 Dry Natural Gas Reserves Revision Increases (Billion Cubic Feet) | |||||
| Decade | Year-0 | Year-1 | Year-2 | Year-3 | Year-4 | Year-5 | Year-6 | Year-7 | Year-8 | Year-9 |
|---|---|---|---|---|---|---|---|---|---|---|
| 1970's | 490 | 897 | 836 | |||||||
| 1980's | 757 | 619 | 945 | 835 | 642 | 820 | 866 | 634 | 741 | 743 |
| 1990's | 821 | 510 | 581 | 591 | 639 | 688 | 547 | 754 | 767 | 1,281 |
| 2000's | 864 | 431 | 745 | 546 | 697 | 464 | 511 | 690 | 1,054 | 828 |
| 2010's | 1,082 | 1,056 | 1,115 | 1,154 | 2,164 | 2,274 | 2,987 | 4,375 | 3,325 | 4,026 |
| 2020's | 4,043 | 6,405 |
| - = No Data Reported; -- = Not Applicable; NA = Not Available; W = Withheld to avoid disclosure of individual company data. |
| Release Date: 12/30/2022 |
| Next Release Date: NA |