|
Download Data (XLS File) |
|
||||||||
|
||||||||
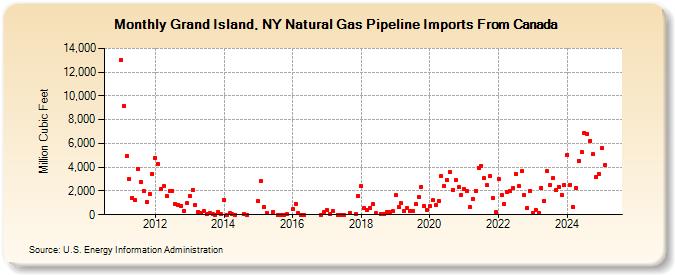
| Grand Island, NY Natural Gas Pipeline Imports From Canada (Million Cubic Feet) | ||||||||
| Year | Jan | Feb | Mar | Apr | May | Jun | Jul | Aug | Sep | Oct | Nov | Dec |
|---|---|---|---|---|---|---|---|---|---|---|---|---|
| 2011 | 13,011 | 9,155 | 4,908 | 3,006 | 1,434 | 1,198 | 3,882 | 2,751 | 1,992 | 1,067 | 1,749 | 3,462 |
| 2012 | 4,801 | 4,288 | 2,138 | 2,383 | 1,575 | 2,037 | 2,018 | 916 | 829 | 773 | 297 | 945 |
| 2013 | 1,579 | 2,099 | 825 | 266 | 117 | 310 | 61 | 118 | 80 | 1 | 270 | 32 |
| 2014 | 1,204 | 17 | 111 | 31 | 8 | 29 | 12 | |||||
| 2015 | 1,125 | 2,816 | 633 | 132 | 196 | 1 | 1 | 5 | 29 | |||
| 2016 | 443 | 926 | 141 | 0 | 0 | 18 | 231 | |||||
| 2017 | 416 | 93 | 340 | 17 | 5 | 7 | 174 | 19 | 1,605 | |||
| 2018 | 2,386 | 558 | 391 | 568 | 880 | 116 | 34 | 32 | 231 | 188 | 278 | |
| 2019 | 1,625 | 630 | 970 | 353 | 547 | 276 | 289 | 873 | 1,471 | 2,337 | 724 | 431 |
| 2020 | 693 | 1,204 | 798 | 1,162 | 3,235 | 2,375 | 2,892 | 3,600 | 2,106 | 2,909 | 2,309 | 1,693 |
| 2021 | 2,134 | 1,987 | 668 | 1,327 | 2,021 | 3,968 | 4,124 | 3,061 | 2,475 | 3,226 | 1,373 | 206 |
| 2022 | 2,982 | 1,666 | 890 | 1,896 | 1,990 | 2,278 | 3,452 | 2,377 | 3,664 | 1,674 | 585 | 2,014 |
| 2023 | 147 | 401 | 135 | 2,290 | 1,179 | 3,673 | 2,498 | 3,084 | 2,101 | 2,371 | 1,700 | 2,519 |
| 2024 | 5,034 | 2,542 | 691 | 2,216 | 4,548 | 5,284 | 6,920 | 6,831 | 6,233 | 5,085 | 3,149 | 3,457 |
| 2025 | 5,713 | 4,168 | 200 | 0 | 0 | 579 | 936 | 1,214 | 413 | 524 | 1,353 | 2,081 |
| 2026 | 2,858 | 3,075 | 1,411 | 1,584 | ||||||||
| - = No Data Reported; -- = Not Applicable; NA = Not Available; W = Withheld to avoid disclosure of individual company data. |
| Release Date: 6/30/2026 |
| Next Release Date: 7/31/2026 |