|
Download Data (XLS File) |
|
||||||||
|
||||||||
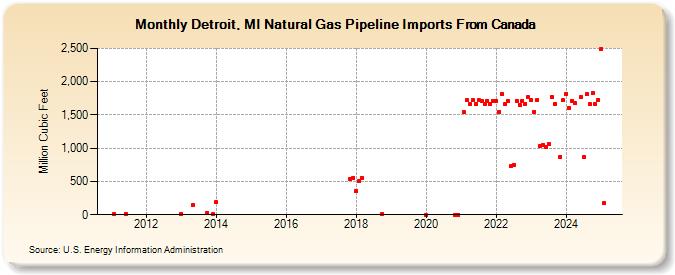
| Detroit, MI Natural Gas Pipeline Imports From Canada (Million Cubic Feet) | ||||||||
| Year | Jan | Feb | Mar | Apr | May | Jun | Jul | Aug | Sep | Oct | Nov | Dec |
|---|---|---|---|---|---|---|---|---|---|---|---|---|
| 2011 | 8 | 11 | ||||||||||
| 2013 | 16 | 140 | 24 | 10 | ||||||||
| 2014 | 188 | |||||||||||
| 2017 | 538 | 556 | ||||||||||
| 2018 | 355 | 503 | 556 | 14 | ||||||||
| 2020 | 0 | 0 | ||||||||||
| 2021 | 0 | 1,538 | 1,717 | 1,661 | 1,717 | 1,661 | 1,717 | 1,716 | 1,661 | 1,716 | 1,668 | 1,713 |
| 2022 | 1,712 | 1,547 | 1,812 | 1,659 | 1,716 | 727 | 751 | 1,715 | 1,654 | 1,714 | 1,669 | 1,765 |
| 2023 | 1,717 | 1,548 | 1,717 | 1,037 | 1,054 | 1,020 | 1,063 | 1,766 | 1,662 | 875 | 1,717 | |
| 2024 | 1,819 | 1,604 | 1,713 | 1,672 | 1,772 | 865 | 1,808 | 1,661 | 1,828 | 1,661 | 1,728 | |
| 2025 | 2,495 | 174 | 29 | 58 | 7 | 48 | 59 | 44 | 0 | |||
| 2026 | 41 | 20 | 25 | 19 | ||||||||
| - = No Data Reported; -- = Not Applicable; NA = Not Available; W = Withheld to avoid disclosure of individual company data. |
| Release Date: 6/30/2026 |
| Next Release Date: 7/31/2026 |