Texas Quick Facts
- Texas is the top crude oil- and natural gas-producing state in the nation. In 2024, Texas accounted for 43% of the nation's crude oil production and 28% of its natural gas gross withdrawals.
- Texas has the most petroleum refineries and the most refining capacity in the nation. The state's 35 refineries can process about 6.3 million barrels of crude oil per calendar day, which is about one-third of the nation's total refining capacity.
- Texas leads the nation in wind electricity generation, accounting for 28% of the U.S. total in 2024.
- In 2024, Texas generated more than twice as much electricity than the next-largest state, Florida, accounting for 13% of the U.S. total.
- Texas's industrial sector energy consumption alone was larger than any state's total energy consumption for all sectors combined, and accounted for 25% of the nation's total industrial sector use in 2024.
Last Updated: August 21, 2025
Data
Last Update: October 16, 2025 | Next Update: November 20, 2025
| Prices | |||||
|---|---|---|---|---|---|
| Petroleum | Texas | U.S. Average | Period | find more | |
| Domestic Crude Oil First Purchase | $ 66.73 /barrel | $ 65.98 /barrel | Jul-25 | ||
| Natural Gas | Texas | U.S. Average | Period | find more | |
| City Gate | NA | $ 5.14 /thousand cu ft | Jul-25 | find more | |
| Residential | NA | $ 25.27 /thousand cu ft | Jul-25 | find more | |
| Coal | Texas | U.S. Average | Period | find more | |
| Average Sales Price | $ 18.76 /short ton | $ 54.04 /short ton | 2023 | ||
| Delivered to Electric Power Sector | $ 1.91 /million Btu | $ 2.40 /million Btu | Jul-25 | ||
| Electricity | Texas | U.S. Average | Period | find more | |
| Residential | 15.36 cents/kWh | 17.47 cents/kWh | Jul-25 | find more | |
| Commercial | 9.03 cents/kWh | 14.15 cents/kWh | Jul-25 | find more | |
| Industrial | 6.60 cents/kWh | 9.29 cents/kWh | Jul-25 | find more | |
| Reserves | |||||
|---|---|---|---|---|---|
| Reserves | Texas | Share of U.S. | Period | find more | |
| Crude Oil (as of Dec. 31) | 20,309 million barrels | 42.0% | 2022 | find more | |
| Expected Future Production of Dry Natural Gas (as of Dec. 31) | 170,262 billion cu ft | 24.6% | 2022 | find more | |
| Expected Future Production of Natural Gas Plant Liquids | 12,376 million barrels | 38.0% | 2022 | find more | |
| Recoverable Coal at Producing Mines | 336 million short tons | 3.0% | 2023 | find more | |
| Rotary Rigs & Wells | Texas | Share of U.S. | Period | find more | |
| Natural Gas Producing Wells | 118,957 wells | 24.6% | 2020 | find more | |
| Capacity | Texas | Share of U.S. | Period | ||
| Crude Oil Refinery Capacity (as of Jan. 1) | 6,343,466 barrels/calendar day | 34.4% | 2025 | ||
| Electric Power Industry Net Summer Capacity | 174,329 MW | 13.9% | Jul-25 | ||
| Supply & Distribution | |||||
|---|---|---|---|---|---|
| Production | Texas | Share of U.S. | Period | find more | |
| Total Energy | 27,105 trillion Btu | 26.4% | 2023 | find more | |
| Crude Oil | 5,802 thousand barrels per day | 42.5% | Jul-25 | find more | |
| Natural Gas - Marketed | 11,526,840 million cu ft | 28.0% | 2023 | find more | |
| Coal | 13,815 thousand short tons | 2.4% | 2023 | find more | |
| Total Utility-Scale Net Electricity Generation | Texas | Share of U.S. | Period | find more | |
| Total Net Electricity Generation | 57,614 thousand MWh | 12.9% | Jul-25 | ||
| Utility-Scale Net Electricity Generation (share of total) | Texas | U.S. Average | Period | ||
| Petroleum-Fired | * | 0.3 % | Jul-25 | find more | |
| Natural Gas-Fired | 52.1 % | 45.4 % | Jul-25 | find more | |
| Coal-Fired | 11.8 % | 18.0 % | Jul-25 | find more | |
| Nuclear | 6.4 % | 15.8 % | Jul-25 | find more | |
| Renewables | 29.4 % | 20.2 % | Jul-25 | ||
| Stocks | Texas | Share of U.S. | Period | find more | |
| Motor Gasoline (Excludes Pipelines) | 3,156 thousand barrels | 30.8% | Jul-25 | ||
| Distillate Fuel Oil (Excludes Pipelines) | 22,735 thousand barrels | 26.5% | Jul-25 | find more | |
| Natural Gas in Underground Storage | 780,876 million cu ft | 10.2% | Jul-25 | find more | |
| Petroleum Stocks at Electric Power Producers | 1,378 thousand barrels | 6.7% | Jul-25 | find more | |
| Coal Stocks at Electric Power Producers | 10,168 thousand tons | 9.3% | Jul-25 | find more | |
| Fueling Stations | Texas | Share of U.S. | Period | ||
| Motor Gasoline | 10,670 stations | 9.8% | 2023 | ||
| Propane | 339 stations | 12.9% | Sep-25 | ||
| Electric Vehicle Charging Locations | 3,832 stations | 5.1% | Sep-25 | ||
| E85 | 251 stations | 5.3% | Sep-25 | ||
| Biodiesel, Compressed Natural Gas, and Other Alternative Fuels | 67 stations | 1.8% | Sep-25 | ||
| Consumption & Expenditures | |||||
|---|---|---|---|---|---|
| Summary | Texas | U.S. Rank | Period | ||
| Total Consumption | 14,138 trillion Btu | 1 | 2023 | find more | |
| Total Consumption per Capita | 460 million Btu | 6 | 2023 | find more | |
| Total Expenditures | $ 173,908 million | 2 | 2023 | find more | |
| Total Expenditures per Capita | $ 5,660 | 12 | 2023 | find more | |
| by End-Use Sector | Texas | Share of U.S. | Period | ||
| Consumption | |||||
| » Residential | 1,565 trillion Btu | 8.5% | 2023 | find more | |
| » Commercial | 1,558 trillion Btu | 9.6% | 2023 | find more | |
| » Industrial | 7,691 trillion Btu | 24.9% | 2023 | find more | |
| » Transportation | 3,324 trillion Btu | 11.9% | 2023 | find more | |
| Expenditures | |||||
| » Residential | $ 28,356 million | 8.6% | 2023 | find more | |
| » Commercial | $ 17,796 million | 7.5% | 2023 | find more | |
| » Industrial | $ 50,060 million | 21.0% | 2023 | find more | |
| » Transportation | $ 77,696 million | 10.2% | 2023 | find more | |
| by Source | Texas | Share of U.S. | Period | ||
| Consumption | |||||
| » Petroleum | 1,592 million barrels | 21.5% | 2023 | find more | |
| » Natural Gas | 5,197 billion cu ft | 15.9% | 2023 | find more | |
| » Coal | 50,908 thousand short tons | 12.0% | 2023 | find more | |
| Expenditures | |||||
| » Petroleum | $ 115,561 million | 12.6% | 2023 | find more | |
| » Natural Gas | $ 14,659 million | 7.3% | 2023 | find more | |
| » Coal | $ 1,695 million | 7.1% | 2023 | find more | |
| Consumption for Electricity Generation | Texas | Share of U.S. | Period | find more | |
| Petroleum | 49 thousand barrels | 2.3% | Jul-25 | find more | |
| Natural Gas | 224,761 million cu ft | 14.7% | Jul-25 | find more | |
| Coal | 4,867 thousand tons | 10.8% | Jul-25 | find more | |
| Energy Source Used for Home Heating (share of households) | Texas | U.S. Average | Period | ||
| Natural Gas | 34.3 % | 46.0 % | 2023 | ||
| Fuel Oil | 0.1 % | 3.7 % | 2023 | ||
| Electricity | 61.2 % | 41.7 % | 2023 | ||
| Propane | 3.0 % | 5.0 % | 2023 | ||
| Other/None | 1.5 % | 3.5 % | 2023 | ||
| Environment | |||||
|---|---|---|---|---|---|
| Renewable Energy Capacity | Texas | Share of U.S. | Period | find more | |
| Total Renewable Energy Electricity Net Summer Capacity | 69,836 MW | 18.1% | Jul-25 | ||
| Ethanol Plant Nameplate Capacity | 430 million gal/year | 2.3% | 2025 | ||
| Renewable Energy Production | Texas | Share of U.S. | Period | find more | |
| Utility-Scale Hydroelectric Net Electricity Generation | 83 thousand MWh | 0.4% | Jul-25 | ||
| Utility-Scale Solar, Wind, and Geothermal Net Electricity Generation | 16,758 thousand MWh | 25.4% | Jul-25 | ||
| Utility-Scale Biomass Net Electricity Generation | 89 thousand MWh | 2.2% | Jul-25 | ||
| Small-Scale Solar Photovoltaic Generation | 545 thousand MWh | 5.5% | Jul-25 | ||
| Fuel Ethanol Production | 8,409 thousand barrels | 2.3% | 2023 | ||
| Renewable Energy Consumption | Texas | U.S. Rank | Period | find more | |
| Renewable Energy Consumption as a Share of State Total | 5.6 % | 39 | 2023 | ||
| Fuel Ethanol Consumption | 37,164 thousand barrels | 1 | 2023 | ||
| Total Emissions | Texas | Share of U.S. | Period | find more | |
| Carbon Dioxide | 669.9 million metric tons | 14.0% | 2023 | ||
| Electric Power Industry Emissions | Texas | Share of U.S. | Period | find more | |
| Carbon Dioxide | 212,769 thousand metric tons | 13.9% | 2023 | ||
| Sulfur Dioxide | 101 thousand metric tons | 11.9% | 2023 | ||
| Nitrogen Oxide | 150 thousand metric tons | 13.4% | 2023 | ||
Analysis
Last Updated: August 21, 2025
Overview
Texas is the nation’s largest energy producer.
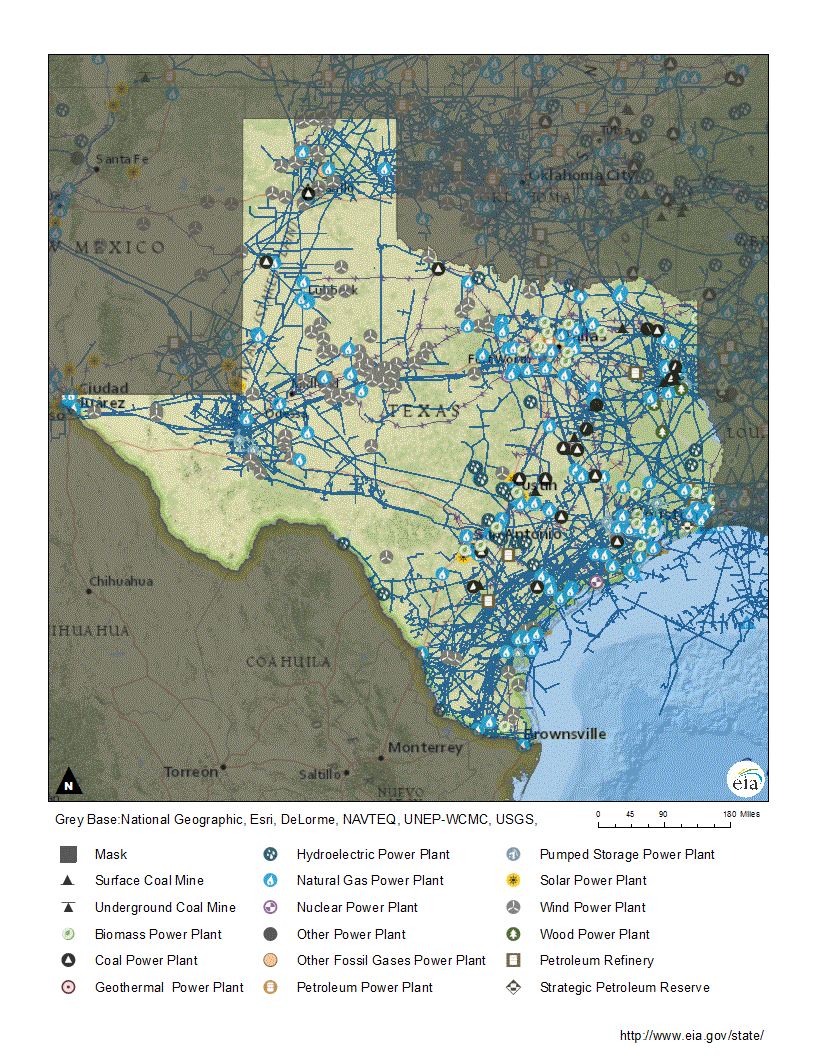
Texas leads the nation in energy production, providing about one-fourth of the country's domestically-produced primary energy.1 Second only to Alaska in total land area, Texas occupies 7% of the nation's total area and stretches about 800 miles at its widest points, east to west and north to south.2 Crude oil and natural gas fields exist across much of that expanse. Coal is also found in bands that cut across the eastern Texas coastal plain and in other areas in the north-central and southwestern parts of the state.3 Additionally, Texas has abundant renewable energy resources and is first in the nation in wind-generated electricity.4 With a significant number of sunny days across vast distances, Texas is among the leading states in solar energy potential and generation.5,6 Geothermal resources suitable for power generation also are found in eastern and southern Texas.7 Uranium for nuclear reactors was mined from sandstone deposits in the Texas coastal plain as early as 1961, and significant resources remain.8,9 More recently, a project that will mine critical minerals for many energy-related technologies is in development in southwest Texas.10,11
Texas ranks second in the nation, after California, in both population and the size of its economy.12,13 Texas is the largest energy-consuming state, accounting for about 15% of the nation's total energy use, and it is sixth among the states in per capita energy consumption.14,15 However, because Texas produces much more energy than it consumes, it is the nation's largest net energy supplier.16 The Texas industrial sector, which includes the energy-intensive chemical manufacturing, crude oil and natural gas extraction, and petroleum refining industries, is the state's largest energy consumer.17,18 The industrial sector accounts for more than half of the state's total energy consumption and 25% of the nation's total industrial sector energy use. The transportation sector is the second-largest end-use energy user in Texas and accounts for about one-fourth of the state's energy consumption.19
The Texas climate varies significantly from east to west. Warm, moist air from the Gulf of America sweeps westward across the state, losing moisture as it goes. The result is a climate that ranges from humid and subtropical along the coast, where much of the state's population resides, to semi-arid on the high plains of central and western Texas and arid in the state's mountainous west. Frequent freezing temperatures occur in winter in the lightly-populated high plains, and summer temperatures average above 90°F in the most densely populated parts of Texas, where energy use for cooling is high.20,21,22 Even so, the residential sector accounts for about one-tenth of the state's total energy consumption. However, in part because of the state's large population, Texas leads the nation in total residential energy use, even though it ranks among the 10 states with the lowest per capita residential energy consumption. The commercial sector accounts for almost as much energy use as the residential sector at about one-tenth of the state's total.23,24
Petroleum
Texas produces more crude oil than any other state and provides more than two-fifths of the nation's total production in 2024.25 The state accounts for more than two-fifths of the nation's crude oil proved reserves and one-fourth of the nation's 100 largest oil fields as measured by reserves. Many of those fields are in the Permian Basin of West Texas and in the Eagle Ford Shale of South Texas.26,27 The discovery of the Spindletop oil field in East Texas started the state's first major oil boom in 1901.28 Later discoveries led to increased state crude oil production until 1972, when Texas's output previously peaked at 1.26 billion barrels. Crude oil production declined steadily for three decades.29 However, hydraulically-fractured horizontal wells drilled in shale formations led to increased crude oil production around 2010.30,31 In 2024, Texas oil production reached a record high, surpassing 2 billion barrels for the second year in a row.32 West Texas Intermediate (WTI), a light (low density), sweet (low sulfur content) crude oil produced in Texas and elsewhere, is the benchmark crude oil price in North America for both physical and futures markets. WTI is the standard price in part because of its ample supply and because of its proximity to a major market trading hub at Cushing, Oklahoma.33
Texas is home to two of the nation's four U.S. Strategic Petroleum Reserve (SPR) crude oil storage sites. In the mid-1970s, Congress created the SPR to offset the impacts of supply disruptions. The SPR, managed by the U.S. Department of Energy, can hold a combined total of 714 million barrels of crude oil in 60 underground salt caverns. The Texas sites near the Gulf Coast have a combined storage capacity of about 417 million barrels.34,35 As of August 2025, the SPR held a total of 403 million barrels of crude oil nationally.36
One-third of the nation’s crude oil refining capacity is in Texas.
Texas has about one-fourth of the nation's operable petroleum refineries and about one-third of the total U.S. crude oil refining capacity. The state's 35 petroleum refineries can process 6.3 million barrels of crude oil per calendar day.37,38 Most Texas refineries are clustered near ports along the Gulf Coast, giving that region the highest concentration of oil refineries in the United States. The largest U.S. refinery is in Port Arthur, Texas, and it can process nearly 641,000 barrels of crude oil per calendar day.39,40 Many of the Texas refineries are complex facilities that can process a wide variety of crude oil types into high-value products, such as motor gasoline, diesel, and chemical feedstocks.41,42,43 Texas refineries send petroleum products by pipeline, barge, and tanker to U.S. markets, primarily in the eastern and central states, and foreign markets.44,45,46 Both hurricanes and winter weather events can affect Texas refinery infrastructure.47,48
Texas consumes more petroleum than any other state, and ranks third in per capita petroleum use, after Louisiana and Alaska.49 The industrial sector accounts for more than three-fifths of the state's petroleum use.50 Texas is one of two states, with Louisiana, where the industrial sector is the largest consumer of petroleum, in part because the petrochemical industry uses large amounts of hydrocarbon gas liquids (HGLs) as feedstocks. Texas is the nation's largest consumer of HGLs, using more than all other states combined. Texas is also the largest consumer of motor gasoline and distillate fuel oil, which includes diesel fuel for highway use.51,52,53 The transportation sector accounts for more than one-third of the petroleum consumed in the state. The commercial and residential sectors together make up about 1% of Texas petroleum use. About 3% of Texas households use petroleum products, primarily propane, for space heating.54,55
Much of Texas can sell conventional motor gasoline without ethanol, but the eastern half of the state and El Paso County in the west require various motor gasoline blends to meet clean air-quality requirements. The metropolitan areas of Greater Houston and Dallas-Fort Worth require reformulated motor gasoline blended with ethanol.56 Texas has four fuel ethanol plants that can produce a combined total of 430 million gallons of ethanol annually.57 Texas consumes about four times more fuel ethanol than the state's plants can produce, and additional supplies come from out of state.58
Natural gas
In 2024, Texas accounted for 28% of the nation's natural gas gross withdrawals.
One-fourth of U.S. proved natural gas reserves and 28 of the nation's 100 largest natural gas fields are located, in whole or in part, in Texas.59,60 In 2024, the state produced a record 13 trillion cubic feet of natural gas gross withdrawals, or about 28% of the nation's total.61 Most of the recent growth in Texas natural gas production came from the Eagle Ford shale and the Permian Basin, in part because of advances in horizontal drilling and hydraulic fracturing technologies.62,63,64
Texas has almost 15,000 miles of interstate natural gas pipelines within its borders.65 Those pipelines transport natural gas from Texas across the nation and into Mexico. Large volumes of natural gas enter the state, primarily through Oklahoma and New Mexico. However, nearly seven times more natural gas left Texas than entered the state in 2023. Slightly more than half of that natural gas went to other states, primarily Louisiana. The rest was exported to 29 countries, with three-fifths of those exports going to Mexico.66
Texas exports natural gas by pipelines and by ships at the state's two liquefied natural gas (LNG) terminals along the Texas Gulf Coast at Freeport and Corpus Christi. The Corpus Christi LNG export facility began operations in 2019 and expanded to nearly double its LNG export capacity in early 2025.67,68 The Freeport LNG import terminal converted into an export terminal and began export operations in 2019.69 Trucks also haul LNG to Mexico from Laredo in southern Texas.70 Several other LNG export facilities are under construction in the state, including the Golden Pass terminal at Sabine Pass, the Rio Grande terminal in Brownsville, and the Sempra terminal in Port Arthur.71,72,73,74,75 In 2024, the United States was the world's largest LNG exporter and Texas's three existing LNG export terminals handled about 31% of all U.S. LNG exports.76,77
Texas stores some natural gas underground for later use. The state has 863 billion cubic feet of underground natural gas storage capacity, about one-tenth of the U.S. total.78 About half of the 37 active storage reservoirs in Texas—around 69% of the state's storage capacity—are depleted oil and gas fields converted for storage use. The rest are salt caverns.79
Texas is the nation's largest natural gas consumer and accounts for about 16% of U.S. total natural gas use.80 Texas uses more natural gas for both electric power and industrial sector purposes than any other state.81,82 In 2024, the electric power sector was the largest consumer of natural gas in Texas, exceeding the industrial sector for the first time since 2015. The electric power sector accounted for 46% of the natural gas delivered to consumers and the industrial sector, excluding direct use by the natural gas industry, was 45%.83 The commercial and residential sectors, together, accounted for about 9% of the natural gas delivered to Texas consumers. About one-third of Texas households rely on natural gas as their primary fuel for space heating.84 Typically, the natural gas sector directly consumes about one-seventh of Texas's total annual natural gas consumption for the production, processing, and distribution of natural gas.85
Coal
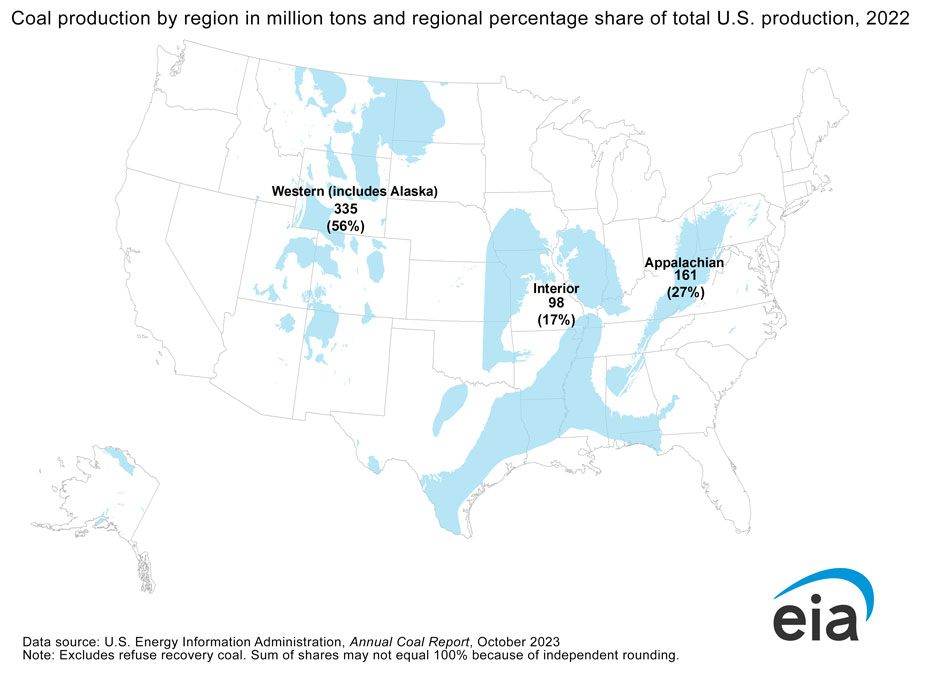
Texas is the second-largest lignite producer in the nation.
Texas has about 9 billion tons of estimated recoverable coal reserves, about 9% of the nation's total.86 All of the coal mined in Texas is lignite, and the state is the second-largest lignite producer in the United States, after North Dakota, and one of four lignite-producing states.87 Lignite is a type of coal with the lowest heat content used almost exclusively for power generation at power plants near lignite mines.88 Substantial lignite deposits are found in a broad band in the Texas Gulf Coast region from the Rio Grande to the Arkansas border.89 Although underground mines produced most of the coal in Texas before the mid-1950s, those mines closed decades ago, and now four surface mines produce all of the state's coal.90,91
Texas is the nation's largest coal consumer, and almost all of it fuels the state's power plants.92,93 On a tonnage basis, Texas lignite accounts for more than one-fourth of the state's total coal consumption by power plants, with nearly all the rest coming from Wyoming by rail. Industrial facilities in the state also receive small amounts of coal from Colorado and Indiana.94,95
Electricity
Texas generates more than twice the amount of electricity than the next-largest state.
Texas generates more than twice as much electricity than the next-largest state, Florida. In 2024, Texas accounted for 13% of the nation's total electricity net generation from utility-scale (1 megawatt or larger) and small-scale (less than 1 megawatt) power plants and generating facilities.96 Natural gas-fired power plants supplied 51% of the electricity generated in Texas. Natural gas fuels more electricity generation in Texas than in any other state and accounted for nearly 16% of all U.S. natural gas-fired generation.97,98 Wind is the second-largest source of in-state generation in Texas. In 2024, wind supplied 22% of Texas's total in-state electricity net generation.99 Coal supplied about 12% of the state's total net generation in 2024, down from 34% in 2014 because of 7,400 megawatts of coal-fired generating capacity retirements in Texas over the period.100,101 Solar power accounted for 8% of Texas's total in-state utility-scale and small-scale generation in 2024, exceeding nuclear power generation for the first time. The state's two operating nuclear power plants provided 7% of the state's total in-state electricity net generation. Other gases, biomass, and hydropower generated most of the state's remaining in-state electricity.102,103
Unlike other states, most of Texas is not connected to the nation's regional power grids and therefore largely dependent on its own resources to meet the state's electricity demand.104 The Electricity Reliability Council of Texas (ERCOT) operates the state's main power grid. The ERCOT grid operates completely within Texas and serves about 75% of the state's land area, 90% of the electric load, and 27 million customers.105 The ERCOT service area does not extend across the state's borders, so ERCOT is not subject to federal oversight.106
Although Texas is the nation's largest electricity consumer, its per capita electricity consumption ranks 10th among the states. In 2024, the residential sector accounted for 34% of Texas's electricity use. Texas leads the nation in residential sector total electricity consumption, but the sector's per capita consumption is less than in one-fourth of the states.107,108 About six in ten Texas households use electricity as their primary source for home heating and almost all homes have air conditioning.109,110 The industrial sector was 33% of the state's electricity consumption, followed closely by the commercial sector at about 32%. Large-scale industrial and commercial computing facilities, such as data centers and cryptocurrency mining operations, are an increasing source of power demand in Texas. The transportation sector which consists of the Texas's public electric rail system accounts for a very small amount of power consumption in the state.111,112 However, Texas ranks third among the states, after California and Florida, with the most electric vehicles (EVs).113 As of July 2025, Texas had about 3,700 EV public charging locations, the fifth-highest amount after California, New York, Massachusetts, and Florida.114
Renewable energy
Texas leads the nation in wind-powered electricity generation.
Renewable sources generated three-tenths of the total in-state electricity in Texas in 2024. The state accounted for about 17% of the nation's total electricity generation from renewable sources.115 In 2024, Texas led the nation in wind-powered electricity generation, producing nearly three-tenths of the U.S. total.116 By the end of 2024, wind powered-generating capacity in Texas was about 42,300 megawatts.117
In 2024, Texas was the country's second-largest producer of solar power, after California. Total solar generating capacity at the state's utility-scale and small-scale facilities was 25,400 megawatts. In 2024, solar energy accounted for about 8% of in-state total electricity net generation. Small-scale, customer-sited solar panels provided about one-tenth of the state's total solar power.118,119 Power plant developers plan to add 11,600 megawatts of utility-scale solar generating capacity in the state during 2025 and 13,100 megawatts in 2026.120
Biomass fueled 0.2% of Texas's total in-state electricity generation in 2024, mostly from wood or wood-derived fuels and smaller amounts from landfill gas.121,122 Texas's biomass resources also provide feedstock for the state's one wood pellet manufacturing plant, which can process wood waste into about 507,000 tons of wood pellets per year.123,124 The state has several biogas facilities that recycle organic waste into renewable energy. Most are at wastewater treatment centers and landfills. The state also has anaerobic digesters that process livestock manure into methane that is used as pipeline gas, furnace fuel, or compressed natural gas.125,126 The state's four biodiesel plants can produce about 174 million gallons of biodiesel each year.127 A new refinery under development in Newton County, Texas, will process one million tons of wood waste into 65 million gallons of transportation biofuels annually, including sustainable aviation fuel and renewable diesel.128,129,130
Hydroelectric power plants accounted for less than 0.2% of in-state electricity in 2024. Although Texas has a large number of non-powered dams, the state has limited potential for hydroelectric generation development.131,132,133 Texas does not have any utility-scale geothermal power plants.134 However, heated water, as hot as 200°C, produced from the thousands of crude oil and natural gas wells in Texas is a potential geothermal resource that could generate electricity. Direct-use applications, such as ground-source heat pumps, use low-temperature geothermal resources at locations around the state.135
In 1999, Texas Public Utility Commission rules required electricity providers to install 10,000 megawatts of renewable electricity generating capacity by 2025. In 2009, Texas exceeded the 2025 goal, mostly because of the state's many wind farms.136 In 2024, Texas had nearly 66,000 megawatts of utility-scale generating capacity from renewables, or 69,000 megawatts including small-scale solar.137 Many municipal utilities, electric cooperatives, and investor-owned utilities offer net metering programs, such as rooftop solar panel systems, to their customers.138,139,140
Endnotes
1 U.S. Energy Information Administration (EIA), State Energy Data System, Table P2, Primary Energy Production Estimates in Trillion Btu, 2023.
2 Texas State Historical Association, Texas Almanac, Texas' Natural Environment, accessed July 14, 2025.
3 U.S. EIA, Interactive GIS Data Viewer, Layers List: State Mask Texas, Oil Wells, Gas Wells, Coal Fields, Coal Fields Layers, accessed July 14, 2025.
4 U.S. EIA, Electricity Data Browser, Net generation for all sectors (thousand megawatthours), All states, Wind, Annual, 2021-24.
5 Roberts, Billy J., Direct Normal Solar Irradiance, Map, National Renewable Energy Laboratory (February 22, 2018).
6 U.S. EIA, Electricity Data Browser, Net generation for all sectors (thousand megawatthours), All states, All Solar, Annual, 2021-24.
7 Roberts, Billy J., Geothermal Resources of the United States, Map, National Renewable Energy Laboratory (February 22, 2018).
8 Texas Bureau of Economic Geology, Uranium, accessed July 14, 2025.
9 Uranium Producers of America, Uranium in America, Uranium in Texas, accessed July 14, 2025.
10 Friend, Daniel, Texas Could Play Central Role in Shift Away from China's Rare Earth Dominance, The Texan (December 27, 2021).
11 U.S. Geological Survey, What is a critical mineral, updated July 14, 2025.
12 U.S. Census Bureau, State Population Totals and Components of Change: 2020-2024, Annual Estimates of the Resident Population for the United States, Regions, States, District of Columbia, and Puerto Rico: April 1, 2020 to July 1, 2024.
13 U.S. Bureau of Economic Analysis, Interactive Data, Regional Data, GDP and Personal Income, Annual Gross Domestic Product (GDP) by State, SAGDP2 GDP in current dollars, All Areas, All Industry Total, 2024.
14 U.S. EIA. State Energy Data System, Table F35, Total Energy Consumption, Price, and Expenditure Estimates, 2023.
15 U.S. EIA, State Energy Data System, Table C14, Energy Consumption Estimates per Capita by End-Use Sector, Ranked by State, 2023.
16 U.S. EIA, State Energy Data System, Table P3, Total Primary Energy Production and Total Energy Consumption Estimates in Trillion Btu, 2023.
17 U.S. EIA. State Energy Data System, Table F35, Total energy consumption, price, and expenditure estimates, 2023.
18 U.S. Bureau of Economic Analysis, Interactive Data, Regional Data, GDP and Personal Income, Annual Gross Domestic Product (GDP) by State, SAGDP2 GDP in current dollars, Texas, All statistics in table, 2023.
19 U.S. EIA, State Energy Data System, Table F35, Total energy consumption, price, and expenditure estimates, 2023.
20 Bomar, George W., Weather, Texas State Historical Association, Handbook of Texas, updated February 1, 1996.
21 U.S. Census Bureau, 2020 Census: Texas Profile, Population Density by Census Tract.
22 U.S. EIA, Residential Energy Consumption Survey (RECS), 2020 RECS Survey Data, State Data, Highlights for air conditioning in U.S. homes by state, 2020.
23 U.S. EIA, State Energy Data System, Table F35, Total energy consumption, price, and expenditure estimates, 2023.
24 U.S. EIA, State Energy Data System, Table C14, Total Energy Consumption Estimates per Capita by End-Use Sector, Ranked by State, 2023.
25 U.S. EIA, Petroleum Supply Monthly, Crude Oil Production, Annual-Thousand Barrels, 2019-24.
26 U.S. EIA, U.S. Crude Oil and Natural Gas Reserves, Year-end 2023 (June 25, 2025), Table 6, Crude oil and lease condensate proved reserves, reserves changes, by states and areas, 2023.
27 U.S. EIA, Top 100 U.S. Oil & Gas Fields (March 2015), p. 5-7, 11.
28 Wooster, Robert, and Christine Moor Sanders, "The Historic Discovery of Spindletop Oilfield: Birth of the Modern Petroleum Industry," Texas State Historical Association, updated April 2, 2019.
29 The Railroad Commission of Texas, Historical Crude Oil Production and Well Counts, History of Texas Initial Crude Oil, Annual Production and Producing Wells Since 1935, 1935-2018.
30 U.S. EIA, U.S. tight oil production—selected plays, 2007-2024.
31 U.S. EIA, "Tight oil production in Permian drives growth in onshore U.S. Lower 48 states production," Today in Energy (June 2, 2025).
32 U.S. EIA, Petroleum and Other Liquids, Texas Field Production of Crude Oil, Annual-Thousand Barrels, 1981-2024.
33 U.S. EIA, "North American crude oil prices are closely, but not perfectly, connected," Today in Energy (May 27, 2020).
34 U.S. Department of Energy, Office of Cybersecurity, Energy Security, and Emergency Response, SPR Storage Sites, accessed July 15, 2025.
35 U.S. Department of Energy, Office of Cybersecurity, Energy Security, and Emergency Response, Petroleum Reserves, Strategic Petroleum Reserve, Infographic: Strategic Petroleum Reserve (March 31, 2025).
36 U.S. EIA, Weekly U.S. Ending Stocks of Crude Oil in SPR, August 8, 2025.
37 U.S. EIA, Number and Capacity of Petroleum Refineries, Total Number of Operable Refineries, Annual (as of January 1), 2025.
38 U.S. EIA, Number and Capacity of Petroleum Refineries, Atmospheric Crude Oil Distillation Operable Capacity (B/CD), Annual (as of January 1), 2025.
39 U.S. EIA, Refinery Capacity Report (June 20, 2025), Table 3, Capacity of Operable Petroleum Refineries by State as of January 1, 2025.
40 U.S. EIA, "U.S. refining capacity largely unchanged as of January 2025," Today in Energy (June 30, 2025).
41 U.S. EIA, Crude Oil Input Qualities, API Gravity, Annual, 2019-24.
42 U.S. EIA, Crude Oil Input Qualities, Sulfur Content, Annual, 2019-24.
43 U.S. EIA, Refinery Net Production, Texas Gulf Coast, and Texas Inland, Annual-Thousand Barrels, 2019-24.
44 U.S. EIA, Movements by Pipeline, Tanker, Barge and Rail between PAD Districts, Petroleum Products, Annual Thousand Barrels, 2019-24, From PADD 3.
45 U.S. EIA, East Coast and Gulf Coast Transportation Fuels Markets (February 2016), Supply and logistics, Markets, p. 87-93.
46 U.S. EIA, "Significant volumes of gasoline and distillate move from the Gulf Coast to the East Coast," Today in Energy (June 28, 2022).
47 U.S. EIA, "Cold weather led to refinery shutdowns in U.S. Gulf Coast region," Today in Energy (March 1, 2021).
48 U.S. EIA, "Refining industry risks from 2025 hurricane season," Today in Energy (May 20, 2025).
49 U.S. EIA, State Energy Data System, Table C15, Petroleum Consumption Estimates, Total and per Capita, Ranked by State, 2023.
50 U.S. EIA, State Energy Data System, Table F16, Total Petroleum Consumption Estimates, 2023.
51 U.S. EIA, State Energy Data System, Table C2, Energy Consumption Estimates for Selected Energy Sources in Physical Units, 2023.
52 U.S. EIA, State Energy Data System, Table F6, Hydrocarbon Gas Liquids Consumption Estimates, 2023.
53 U.S. EIA, Hydrocarbon Gas Liquids Explained, updated December 26, 2023.
54 U.S. Census Bureau, Tables, Table B25040, House Heating Fuel, Texas, 2023 American Community Survey 1-Year Estimates.
55 U.S. EIA, State Energy Data System, Table F16, Total Petroleum Consumption Estimates, 2023.
56 Southern States Energy Board, Gardner, K. W., U.S. Gasoline Requirements, (January 2018).
57 U.S. EIA, U.S. Fuel Ethanol Plant Production Capacity (August 15, 2024), Detailed annual production capacity by plant is available in XLSX.
58 U.S. EIA, State Energy Data System, Table F3, Fuel Ethanol Consumption Estimates, 2023.
59 U.S. EIA, U.S. Crude Oil and Natural Gas Reserves, Year-end 2023 (June 25, 2025), Table 8, Natural gas, wet after least separation, proved reserves, reserves changes, by sales and areas, 2023.
60 U.S. EIA, Top 100 U.S. Oil & Gas Fields (March 2015), p. 8-10.
61 U.S. EIA, Natural Gas Gross Withdrawals and Production, Gross withdrawals, Texas, Annual, 2024.
62 U.S. EIA, Natural Gas Gross Withdrawals and Production, Gross Withdrawals from Shale Gas Wells, Texas, Annual-Million Cubic Feet, 2007-24.
63 Railroad Commission of Texas, Eagle Ford Shale, Statistics, Historical Production, Eagle Ford Shale 2008 To Current, available in XLSX format, accessed July 16, 2025.
64 Railroad Commission of Texas, Permian Basin, Statistics, Historical Production, Permian Basin 2008 to Current, available in XLSX format, accessed July 16, 2025.
65 Texas Railroad Commission, Texas Pipeline System Mileage, accessed July 16, 2025.
66 U.S. EIA, International and Interstate Movements of Natural Gas by State, Texas, Annual 2018-23.
67 Cheniere Energy, Inc., Where we work, Corpus Christi, Corpus Christi Liquefaction, accessed July 16, 2025.
68 U.S. EIA, "First liquefied natural gas cargo produced at Corpus Christi Stage 3 export facility," Today in Energy (March 11, 2025).
69 Freeport LNG Development, L.P., Corporate History, Brief History of Freeport LNG, accessed July 16, 2025.
70 Chapa, Sergio, "Keep on Trucking: 18-wheelers haul LNG exports into Mexico," Houston Chronicle (April 23, 2019).
71 Golden Pass LNG Terminal LLC, LNG Export Project, accessed July 16, 2025.
72 Next Decade Corporation, Rio Grande LNG, accessed July 16, 2025.
73 Sempra Infrastructure, Port Arthur LNG, accessed July 16, 2025.
74 U.S. Federal Energy Regulatory Commission, U.S. LNG Export Terminals: Existing, Approved Not Yet Built, and Proposed, updated July 22, 2025.
75 U.S. EIA, Natural Gas, Imports/Exports, U.S. Liquefaction Capacity, accessed July 16, 2025.
76 U.S. EIA, "The United States remained the world's largest liquefied natural gas exporter in 2024," Today in Energy (March 27, 2025).
77 U.S. EIA, U.S. Natural Gas Exports and Re-Exports by Point of Exit, Liquefied Natural Gas Volumes, Annual, 2019-24.
78 U.S. EIA, Underground Natural Gas Storage Capacity, Total Storage Capacity (Million Cubic Feet), Annual, 2018-23.
79 U.S. EIA, Underground Natural Gas Storage Capacity, Texas, Annual, 2018-23.
80 U.S. EIA, Natural Gas Consumption by End Use (Million Cubic Feet), Total Consumption, Annual, 2019-23.
81 U.S. EIA, Share of Total U.S. Natural Gas Delivered to Consumers (Percentage), Industrial, Annual, 2018-23.
82 U.S. EIA, Share of Total U.S. Natural Gas Delivered to Consumers (Percentage), Electric Power, Annual, 2018-23.
83 U.S. EIA, Natural Gas Consumption by End-Use (Million Cubic Feet), Texas, Annual, 2019-24.
84 U.S. Census Bureau, Tables, Table B25040, House Heating Fuel, Texas, 2023 American Community Survey 1-Year Estimates.
85 U.S. EIA, Natural Gas Consumption by End-Use (Million Cubic Feet), Texas, Annual, 2019-24.
86 U.S. EIA, Annual Coal Report (October 30, 2024), Table 15, Recoverable Coal Reserves at Producing Mines, Estimated Recoverable Reserves, and Demonstrated Reserve Base by Mining Method, 2023.
87 U.S. EIA, Annual Coal Report (October 30, 2024), Table 6, Coal Production and Number of Mines by State and Coal Rank, 2023.
88 U.S. EIA, Glossary, Lignite, accessed July 17, 2025.
89 Henderson, Dwight F., and Diana J. Kleiner, "Coal and Lignite Resources: History and Production," Texas State Historical Association, Handbook of Texas, updated September 26, 2019.
90 Garner, L. Edwin, "Minerals and Mineral Products of Texas: Comprehensive Overview," Coal, Lignite, Texas State Historical Association, Handbook of Texas, updated January 19, 2019.
91 U.S. EIA, Annual Coal Report (October 30, 2024), Table 1, Coal Production and Number of Mines by State and Mine Type, 2023.
92 U.S. EIA, State Energy Data System, Table C12, Primary Energy Consumption Estimates by Source, Ranked by State, 2023.
93 U.S. EIA, Annual Coal Report (October 30, 2024), Table 26, U.S. Coal Consumption by End Use Sector, Census Division, and State, 2023 and 2022.
94 U.S. EIA, Annual Coal Report (October 30, 2024), Table 6, Coal Production and Number of Mines by State and Coal Rank, 2023.
95 U.S. EIA, Annual Coal Distribution Report (October 30, 2024), Domestic distribution of U.S. coal by: Origin State, consumer, destination and method of transportation, Texas, Table OS-21, Domestic Coal Distribution, by Origin State, 2023, and Destination State, consumer, destination and method of transportation, Texas, Table DS-37, Domestic Coal Distribution, by Destination State, 2023.
96 U.S. EIA, Electric Power Monthly (February 2025), Table 1.3.B., Table 1.17.B.
97 U.S. EIA, Electricity Data Browser, Net generation for all sectors (thousand megawatthours), Texas, Annual, 2001-24.
98 U.S. EIA, Electric Power Monthly (February 2025), Table 1.3.B., Table 1.7.B, Table 1.17.B.
99 U.S. EIA, Electricity Data Browser, Net generation for all sectors (thousand megawatthours), Texas, Annual, 2001-24.
100 U.S. EIA, Electricity Data Browser, Net generation for all sectors (thousand megawatthours), Texas, Annual, 2001-24.
101 U.S. EIA, Electricity, Preliminary Monthly Electric Generator Inventory (based on Form EIA-860M as a supplement to Form EIA-860), Inventory of Retired Generators as of June 2025, Plant State: Texas, Technology: Conventional Steam Coal.
102 U.S. Nuclear Regulatory Commission, Texas, Operating Nuclear Power Reactors, updated March 9, 2021.
103 U.S. EIA, Electricity Data Browser, Net generation for all sectors (thousand megawatthours), Texas, Annual, 2001-24.
104 Texas State Historical Association, Texas Almanac, Texas Electric Grids: Demand and Supply, accessed July 18, 2025.
105 ERCOT, About ERCOT, Company Profile, accessed July 18, 2025.
106 Morehouse, Catherine, "Congress, Texas should 'rethink' ERCOT's 'go it alone approach': FERC Chair Glick," Utility Dive (February 19, 2021).
107 U.S. EIA, State Energy Data System, Table C17, Electricity Sales to Ultimate Customers, Total and Residential, Total and per Capita, Ranked by State, 2023.
108 U.S. EIA, Electricity Data Browser, Retail sales of electricity (million kilowatthours), Texas, All sectors, Annual, 2001-24.
109 U.S. Census Bureau, Tables, Table B25040, House Heating Fuel, Texas, 2023 American Community Survey 1-Year Estimates.
110 U.S. EIA, Residential Energy Consumption Survey (RECS), 2020 RECS Survey Data, State Data, Housing Characteristics, Highlights for air conditioning in U.S. homes by state, 2020.
111 U.S. EIA, Electricity Data Browser, Retail sales of electricity (million kilowatthours), Texas, All sectors, Annual, 2001-24.
112 U.S. EIA, "Data centers and cryptocurrency mining in Texas drive strong power demand growth," Today in Energy (October 3, 2024).
113 U.S. EIA, State Energy Data System, Table F39, Electric light-duty vehicles overview, 2023.
114 U.S. EIA, Monthly Energy Review (July 28, 2025), Appendix F monthly state file, Public ports only and Public & private ports combined.
115 U.S. EIA, Electricity Data Browser, Net generation for all sectors (thousand megawatthours), United States, Texas, All fuels, Conventional hydroelectric, Other renewables (total), Small-scale solar photovoltaic, Annual, 2001-24.
116 U.S. EIA, Electric Power Monthly (February 2025), Table 1.14.B.
117 U.S. EIA, Electric Power Monthly (February 2025), Table 6.2.A, Table 6.2.B.
118 U.S. EIA, Electric Power Monthly (February 2025), Table 1.17.B, Table 6.2.B.
119 U.S. EIA, Electricity Data Browser, Net generation for all sectors (thousand megawatthours), Texas, Annual, 2021-24.
120 U.S. EIA, Electricity, Preliminary Monthly Electric Generator Inventory (based on Form EIA-860M as a supplement to Form EIA-860), Inventory of Planned Generators as of December 2024, Plant State: Texas, Technology: Solar Photovoltaic.
121 U.S. EIA, Electricity Data Browser, Net generation for all sectors (thousand megawatthours), Texas, Annual, 2001-24.
122 U.S. EIA, Electricity, Preliminary Monthly Electric Generator Inventory (based on Form EIA-860M as a supplement to Form EIA-860), Inventory of Operating Generators as of June 2025, Plant State: Texas, Technology: Landfill Gas.
123 Woodville Pellets, About Woodville Pellets, accessed July 23, 2025.
124 U.S. EIA, Monthly Densified Biomass Fuel Report (July 10, 2025), Table 1, Densified biomass fuel manufacturing facilities in the United States by state, region, and capacity, March 2025.
125 American Biogas Council, Biogas State Profiles, Texas, accessed July 23, 2025.
126 U.S. Environmental Protection Agency, AgSTAR, Livestock Anaerobic Digester Database, Texas, accessed July 23, 2025.
127 U.S. EIA, U.S. Biodiesel Plant Production Capacity (August 15, 2024), Detailed annual production capacity by plant is available in XLSX.
128 "USA BioEnergy to build $1.7 bn biorefinery in Texas," Upstream (February 16, 2022).
129 Stewart, Steve, "USA BioEnergy and Southwest Airlines enter 20 year fuel agreement," KJAS (November 10, 2023).
130 "USA BioEnergy secures long-term feedstocks supply for $2.8 billion SAF refinery in Texas," Biomass Magazine (June 10, 2025).
131 Hadjerioua, Boualem, et. al, An Assessment of Energy Potential at Non-Powered Dams in the United States, U.S. Department of Energy, Energy Efficiency and Renewable Energy (April 2012), p. 8.
132 U.S. EIA, Electricity, Preliminary Monthly Electric Generator Inventory (based on Form EIA-860M as a supplement to Form EIA-860), Inventory of Operating Generators as of June 2025, Plant State: Texas, Technology: Conventional Hydroelectric.
133 U.S. EIA, Electricity Data Browser, Net generation for all sectors (thousand megawatthours), Texas, Annual, 2001-24.
134 U.S. EIA, Electricity Data Browser, Net generation for all sectors (thousand megawatthours), Texas, Annual, 2001-24.
135 The University of Texas at Austin, The Future of Geothermal in Texas, Executive Summary, (January 2023), p. 4, 8.
136 NC Clean Energy Technology Center, DSIRE, Texas, Renewable Generation Requirement, updated December 5, 2023.
137 U.S. EIA, Electric Power Monthly (February 2025), Table 6.2.B.
138 Environment Texas, Does Texas have net Metering? (January 27, 2023).
139 NC Clean Energy Technology Center, DSIRE, Texas, Programs, accessed July 23, 2025.
140 Pressler, Mary, Texas Net Metering and Solar Buyback Programs, Quick Electricity.com, updated May 18, 2025.
Other Resources
Energy-Related Regions and Organizations
- Coal Region: Interior
- Petroleum Administration for Defense District (PADD): 3
- Regional Transmission Organization (RTO) and Independent System Operator (ISO): Midcontinent Independent System Operator (MISO), Southwest Power Pool (SPP)
- North American Electric Reliability Corporation (NERC) ERO Enterprise: Regional Entities: Electric Reliability Council of Texas (ERCOT), Midwest Reliability Organization (MRO), SERC Reliability Corporation (SERC), Texas Reliability Entity (TRE), Western Electricity Coordinating Council (WECC)