Louisiana Quick Facts
- Louisiana ranks third highest in marketed natural gas production and seventh in proved natural gas reserves among the states. Louisiana accounts for about 9% of U.S. total marketed natural gas production and holds 5% of the nation's natural gas reserves.
- The United States was the world's largest liquefied natural gas exporter in 2024, with Louisiana handling 61% of U.S. LNG exports.
- Louisiana's 15 crude oil refineries account for about one-sixth of the nation's refining capacity and can process nearly 3 million barrels of crude oil per calendar day.
- Louisiana's total energy consumption ranks fourth among the states and its per capita energy consumption is the second highest, largely because of its energy-intensive chemical, petroleum, and natural gas industries.
- Louisiana has the highest per capita residential sector electricity consumption in the nation. About 6 in 10 Louisiana households rely on electric heating and nearly all households have air conditioning.
Last Updated: August 21, 2025
Data
Last Update: October 16, 2025 | Next Update: November 20, 2025
| Prices | |||||
|---|---|---|---|---|---|
| Petroleum | Louisiana | U.S. Average | Period | find more | |
| Domestic Crude Oil First Purchase | $ 67.71 /barrel | $ 65.98 /barrel | Jul-25 | ||
| Natural Gas | Louisiana | U.S. Average | Period | find more | |
| City Gate | NA | $ 5.14 /thousand cu ft | Jul-25 | find more | |
| Residential | NA | $ 25.27 /thousand cu ft | Jul-25 | find more | |
| Coal | Louisiana | U.S. Average | Period | find more | |
| Average Sales Price | W | $ 54.04 /short ton | 2023 | ||
| Delivered to Electric Power Sector | W | $ 2.40 /million Btu | Jul-25 | ||
| Electricity | Louisiana | U.S. Average | Period | find more | |
| Residential | 13.02 cents/kWh | 17.47 cents/kWh | Jul-25 | find more | |
| Commercial | 11.57 cents/kWh | 14.15 cents/kWh | Jul-25 | find more | |
| Industrial | 6.81 cents/kWh | 9.29 cents/kWh | Jul-25 | find more | |
| Reserves | |||||
|---|---|---|---|---|---|
| Reserves | Louisiana | Share of U.S. | Period | find more | |
| Crude Oil (as of Dec. 31) | 446 million barrels | 0.9% | 2022 | find more | |
| Expected Future Production of Dry Natural Gas (as of Dec. 31) | 40,296 billion cu ft | 5.8% | 2022 | find more | |
| Expected Future Production of Natural Gas Plant Liquids | 187 million barrels | 0.6% | 2022 | find more | |
| Recoverable Coal at Producing Mines | 12 million short tons | 0.1% | 2023 | find more | |
| Rotary Rigs & Wells | Louisiana | Share of U.S. | Period | find more | |
| Natural Gas Producing Wells | 14,867 wells | 3.1% | 2020 | find more | |
| Capacity | Louisiana | Share of U.S. | Period | ||
| Crude Oil Refinery Capacity (as of Jan. 1) | 2,982,647 barrels/calendar day | 16.2% | 2025 | ||
| Electric Power Industry Net Summer Capacity | 24,807 MW | 2.0% | Jul-25 | ||
| Supply & Distribution | |||||
|---|---|---|---|---|---|
| Production | Louisiana | Share of U.S. | Period | find more | |
| Total Energy | 4,998 trillion Btu | 4.9% | 2023 | find more | |
| Crude Oil | 73 thousand barrels per day | 0.5% | Jul-25 | find more | |
| Natural Gas - Marketed | 4,326,182 million cu ft | 10.5% | 2023 | find more | |
| Coal | 289 thousand short tons | 0.1% | 2023 | find more | |
| Total Utility-Scale Net Electricity Generation | Louisiana | Share of U.S. | Period | find more | |
| Total Net Electricity Generation | 9,983 thousand MWh | 2.2% | Jul-25 | ||
| Utility-Scale Net Electricity Generation (share of total) | Louisiana | U.S. Average | Period | ||
| Petroleum-Fired | NM | 0.3 % | Jul-25 | find more | |
| Natural Gas-Fired | 73.5 % | 45.4 % | Jul-25 | find more | |
| Coal-Fired | 3.9 % | 18.0 % | Jul-25 | find more | |
| Nuclear | 15.3 % | 15.8 % | Jul-25 | find more | |
| Renewables | 4.8 % | 20.2 % | Jul-25 | ||
| Stocks | Louisiana | Share of U.S. | Period | find more | |
| Motor Gasoline (Excludes Pipelines) | 737 thousand barrels | 7.2% | Jul-25 | ||
| Distillate Fuel Oil (Excludes Pipelines) | 7,052 thousand barrels | 8.2% | Jul-25 | find more | |
| Natural Gas in Underground Storage | 605,430 million cu ft | 7.9% | Jul-25 | find more | |
| Petroleum Stocks at Electric Power Producers | 168 thousand barrels | 0.8% | Jul-25 | find more | |
| Coal Stocks at Electric Power Producers | 3,976 thousand tons | 3.6% | Jul-25 | find more | |
| Fueling Stations | Louisiana | Share of U.S. | Period | ||
| Motor Gasoline | 2,237 stations | 2.0% | 2023 | ||
| Propane | 37 stations | 1.4% | Sep-25 | ||
| Electric Vehicle Charging Locations | 283 stations | 0.4% | Sep-25 | ||
| E85 | 20 stations | 0.4% | Sep-25 | ||
| Biodiesel, Compressed Natural Gas, and Other Alternative Fuels | 10 stations | 0.3% | Sep-25 | ||
| Consumption & Expenditures | |||||
|---|---|---|---|---|---|
| Summary | Louisiana | U.S. Rank | Period | ||
| Total Consumption | 4,167 trillion Btu | 4 | 2023 | find more | |
| Total Consumption per Capita | 908 million Btu | 2 | 2023 | find more | |
| Total Expenditures | $ 34,997 million | 14 | 2023 | find more | |
| Total Expenditures per Capita | $ 7,628 | 4 | 2023 | find more | |
| by End-Use Sector | Louisiana | Share of U.S. | Period | ||
| Consumption | |||||
| » Residential | 280 trillion Btu | 1.5% | 2023 | find more | |
| » Commercial | 224 trillion Btu | 1.4% | 2023 | find more | |
| » Industrial | 2,913 trillion Btu | 9.4% | 2023 | find more | |
| » Transportation | 751 trillion Btu | 2.7% | 2023 | find more | |
| Expenditures | |||||
| » Residential | $ 4,199 million | 1.3% | 2023 | find more | |
| » Commercial | $ 3,006 million | 1.3% | 2023 | find more | |
| » Industrial | $ 16,095 million | 6.7% | 2023 | find more | |
| » Transportation | $ 11,696 million | 1.5% | 2023 | find more | |
| by Source | Louisiana | Share of U.S. | Period | ||
| Consumption | |||||
| » Petroleum | 384 million barrels | 5.2% | 2023 | find more | |
| » Natural Gas | 2,070 billion cu ft | 6.3% | 2023 | find more | |
| » Coal | 3,377 thousand short tons | 0.8% | 2023 | find more | |
| Expenditures | |||||
| » Petroleum | $ 21,955 million | 2.4% | 2023 | find more | |
| » Natural Gas | $ 5,930 million | 2.9% | 2023 | find more | |
| » Coal | $ 196 million | 0.8% | 2023 | find more | |
| Consumption for Electricity Generation | Louisiana | Share of U.S. | Period | find more | |
| Petroleum | NM | NM | Jul-25 | find more | |
| Natural Gas | 53,609 million cu ft | 3.5% | Jul-25 | find more | |
| Coal | 248 thousand tons | 0.6% | Jul-25 | find more | |
| Energy Source Used for Home Heating (share of households) | Louisiana | U.S. Average | Period | ||
| Natural Gas | 32.0 % | 46.0 % | 2023 | ||
| Fuel Oil | 0.1 % | 3.7 % | 2023 | ||
| Electricity | 64.7 % | 41.7 % | 2023 | ||
| Propane | 2.0 % | 5.0 % | 2023 | ||
| Other/None | 1.3 % | 3.5 % | 2023 | ||
| Environment | |||||
|---|---|---|---|---|---|
| Renewable Energy Capacity | Louisiana | Share of U.S. | Period | find more | |
| Total Renewable Energy Electricity Net Summer Capacity | 1,765 MW | 0.5% | Jul-25 | ||
| Ethanol Plant Nameplate Capacity | -- | -- | 2025 | ||
| Renewable Energy Production | Louisiana | Share of U.S. | Period | find more | |
| Utility-Scale Hydroelectric Net Electricity Generation | 58 thousand MWh | 0.3% | Jul-25 | ||
| Utility-Scale Solar, Wind, and Geothermal Net Electricity Generation | 255 thousand MWh | 0.4% | Jul-25 | ||
| Utility-Scale Biomass Net Electricity Generation | 165 thousand MWh | 4.0% | Jul-25 | ||
| Small-Scale Solar Photovoltaic Generation | 38 thousand MWh | 0.4% | Jul-25 | ||
| Fuel Ethanol Production | 0 thousand barrels | 0.0% | 2023 | ||
| Renewable Energy Consumption | Louisiana | U.S. Rank | Period | find more | |
| Renewable Energy Consumption as a Share of State Total | 3.3 % | 48 | 2023 | ||
| Fuel Ethanol Consumption | 5,239 thousand barrels | 25 | 2023 | ||
| Total Emissions | Louisiana | Share of U.S. | Period | find more | |
| Carbon Dioxide | 183.8 million metric tons | 3.8% | 2023 | ||
| Electric Power Industry Emissions | Louisiana | Share of U.S. | Period | find more | |
| Carbon Dioxide | 42,944 thousand metric tons | 2.8% | 2023 | ||
| Sulfur Dioxide | 24 thousand metric tons | 2.8% | 2023 | ||
| Nitrogen Oxide | 53 thousand metric tons | 4.7% | 2023 | ||
Analysis
Last Updated: August 21, 2025
Overview
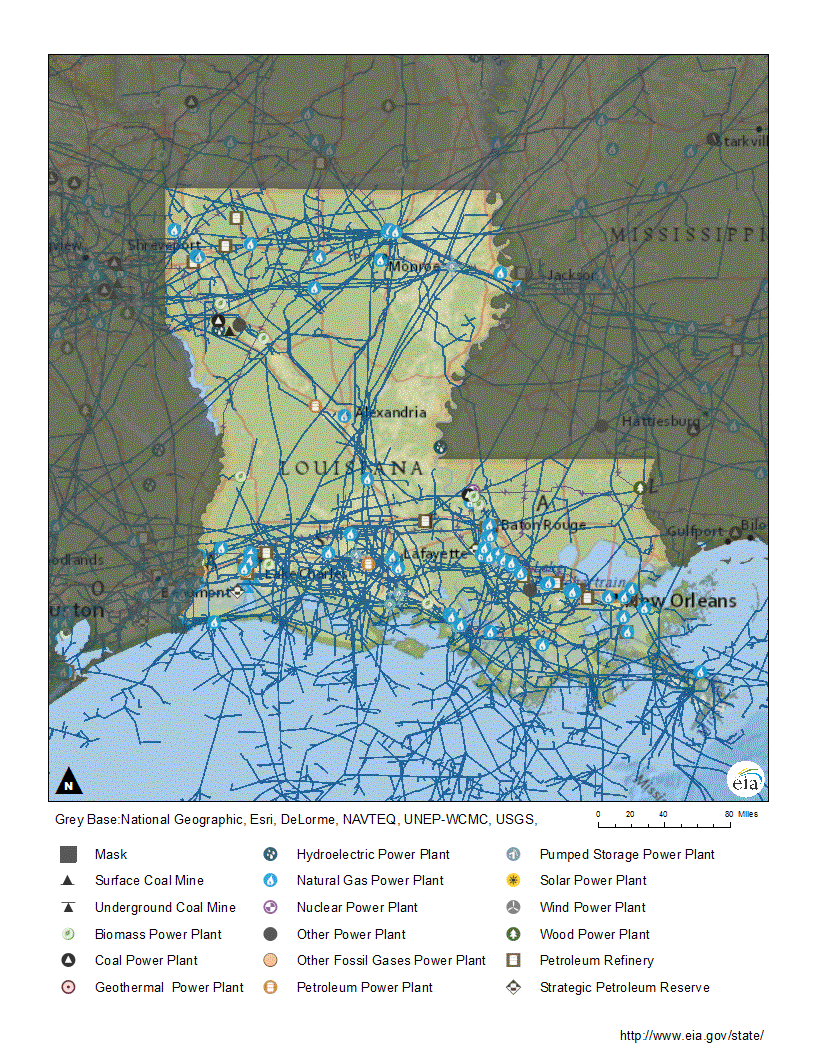
Situated at the mouth of the Mississippi River, Louisiana has abundant crude oil and natural gas reserves both onshore and offshore, buried beneath the thick sediments of the Mississippi Delta.1 In addition to crude oil, natural gas, and minor deposits of coal, Louisiana's energy resources include substantial biomass resources from agricultural byproducts, wood, and wood waste.2,3,4,5 Louisiana's subtropical climate—with the highest annual rainfall in the Lower 48 states at nearly 5 feet—and rich soils create a diverse agricultural economy. These products include soybeans, sugarcane, corn, rice, and livestock.6,7,8 Forested land covers about half of the state.9
Louisiana's total energy consumption ranks fourth among the states and its per capita energy consumption is the second highest in the nation, after Alaska, largely because of the energy-intensive chemical, petroleum, and natural gas industries in the state's industrial sector.10,11,12 Energy consumption in Louisiana's industrial sector, about 70% of the state total, is second only to that of Texas. The transportation sector accounts for 18% of the state's total energy use. The residential sector accounts for about 7%.13 Louisiana's demand for air conditioning is high during the hot, humid summer months, while its demand for heating is limited during the mild winter months.14,15 The commercial sector accounts for about 5% of the state's total energy consumption.16
Natural gas
Louisiana has the third-highest marketed natural gas production and the seventh-highest natural gas reserves among the states. The state accounts for about 9% of U.S. total marketed natural gas production and holds 5% of U.S. natural gas proved reserves.17,18 Among its many productive formations is the Haynesville Shale located in northwestern Louisiana and northeastern Texas. Haynesville is one of seven key U.S. natural gas-producing regions.19,20 Typically, about one-seventh of the state's total natural gas consumption is used in the production and distribution of the state's oil and gas resources.21 Louisiana uses more natural gas to maintain pressure in its many pipelines than any other state.22
Louisiana is the third-largest total natural gas-consuming state, after Texas and California, and the second-largest natural gas consumer on a per capita basis, after Alaska.23 The industrial sector, excluding direct use by the natural gas industry, accounts for 72% of the natural gas delivered to consumers in Louisiana, and the electric power sector uses 24%. About one out of three Louisiana households rely on natural gas for home heating, but the share of gas consumed by the residential sector is small—about 2% of the state's natural gas deliveries to consumers—in part because of Louisiana's mild winters. The commercial sector accounts for about 2% of natural gas use, and the transportation sector uses a very minor amount of natural gas as vehicle fuel.24,25,26,27
Louisiana receives natural gas from and delivers gas supplies to other states via a vast network of interstate pipelines, totaling about 85,000 miles.28,29 In 2023, Louisiana received a near-record 4.3 trillion cubic feet of natural gas and delivered a record 6.5 trillion cubic feet of natural gas. About three-fifths of the natural gas that enters Louisiana came from Texas and one-fourth came from Mississippi. The rest came from the Gulf of America, Arkansas, and Ohio.30,31 Domestically, Louisiana plays an essential role in the movement of natural gas from the U.S. Gulf Coast region to markets throughout the country. The state has the best-known natural gas market center in North America-the Henry Hub in Erath, Louisiana-where nine interstate and three intrastate pipelines connect to major markets throughout the country. The Henry Hub, which can transport about 1.8 million cubic feet per day, is the benchmark price location for natural gas physical and futures trading on the New York Mercantile Exchange.32,33,34 About three-fifths of the natural gas that leaves Louisiana goes through Mississippi, Arkansas, and Texas to other regional markets. The state's four liquefied natural gas (LNG) export terminals ship the other two-fifths to about 30 countries, including the Netherlands, France, United Kingdom, South Korea, and Japan.35,36
In 2024, Louisiana’s four LNG terminals handled three-fifths of U.S. LNG exports.
The United States is the world's largest LNG exporter and shipped 11.9 billion cubic feet per day of LNG in 2024.37 Louisiana handled three-fifths of those shipments at its four operating LNG export terminals. Sabine Pass is the largest U.S. operating LNG terminal, handling about 1.5 trillion cubic feet in natural gas exports, or 35% of the U.S. total.38 Several new LNG terminals are at various stages of construction in Louisiana.39
Louisiana has 19 underground natural gas storage sites located in salt caverns and depleted oil and natural gas fields that can hold 741 billion cubic feet of natural gas, accounting for 8% of total U.S. underground storage capacity.40 Those storage facilities allow Louisiana to meet high natural gas demand periods during winter and summer, along with increasing global need for LNG. Historically, U.S. natural gas demand is highest in the winter, when homes need it for heating. With the growing use of natural gas for U.S. electricity generation, Louisiana withdraws natural gas from storage during the summer months as well, when electricity demand rises for air conditioning.41,42,43
Petroleum
Louisiana ranks among the top 10 states in both crude oil reserves and crude oil production and accounts for about 1% of both U.S. total oil reserves and output.44,45 The state's crude oil production fell below 100,000 barrels per day in 2023 and in 2024 saw the lowest output level in at least six decades, at 84,000 barrels per day.46,47
Crude oil production in Louisiana started early in the 20th century, soon after the 1901 discovery of the Spindletop oil field just across the border in Texas.48 In 1947, the first U.S. offshore commercial crude oil well was completed about 10 miles off the Louisiana coast. Although the water was only 18 feet deep, the well was a significant achievement in opening the Gulf Coast to crude oil exploration and production. Today, the Gulf Coast is one of the largest U.S. crude oil-producing regions and holds substantial oil reserves.49,50,51 Many of the nation's largest oil fields are found off the Louisiana coast in federal waters, and a large share of federal production in Gulf waters is piped onshore to Louisiana.52,53
The Louisiana Offshore Oil Port (LOOP) is the nation's first and only deepwater oil port.
In 2024, Louisiana ranked 11th among states that receive foreign crude oil imports, mostly from Venezuela and Mexico, about 3% of total U.S. imports.54 Crude oil arrives at several state ports, including the Louisiana Offshore Oil Port (LOOP). The LOOP, which began receiving foreign crude oil in 1981, is the nation's first and only deepwater oil port. It provides offloading for some of the largest tankers in the world and can receive up to 100,000 barrels of crude oil per hour.55 It is the single largest point of entry for waterborne crude oil shipped to the United States.56 The LOOP's onshore facilities include the Clovelly Dome Storage facility, where approximately 60 million barrels of crude oil can be stored in eight man-made caverns hollowed out from a salt cavern. The LOOP has 22 above ground storage tanks with approximately 12 million barrels of capacity.57 Through a network of crude oil pipelines, the LOOP connects to several refineries in Louisiana, as well as refineries in the Midwest.58 The LOOP is the only U.S. port that can load very large crude carriers, which can take 2.5 days per tanker.59,60
Louisiana is home to two of the four storage sites that make up the U.S. Strategic Petroleum Reserve (SPR). The emergency stockpile can hold up to 714 million barrels of crude oil. The two Louisiana SPR sites-Bayou Choctaw with 6 underground storage caverns and West Hackberry with 21 underground storage caverns-have a combined storage capacity of about 296 million barrels.61 As of July 2025, the SPR held almost 403 million barrels of crude oil.62
Louisiana's 15 oil refineries account for about one-sixth of the nation's refining capacity and can process almost 3 million barrels of crude oil per calendar day. The state has the most number of refineries after Texas, and 3 Louisiana refineries rank in the top 10 largest refineries by capacity in the nation.63,64,65 Many of these refineries are located in the southern part of the state, putting them at increased risk of disruptions due to major storm events.66,67 In 2024, six refineries were in the path of Hurricane Francine and had some minor damage.68 Louisiana refineries can process a wide variety of crude oil types from around the world, although the state's refineries use less foreign oil than in the past.69,70,71
Louisiana has an extensive pipeline network to support its upstream and downstream oil industries.72 The 3,100-mile PPL Pipeline is one of the nation's largest refined petroleum product pipelines. It runs from near Baton Rouge, Louisiana, through several southern states and terminates in the suburbs of Washington, DC. The pipeline distributes about 720,000 barrels per day of motor gasoline, jet fuel, diesel fuel, and biodiesel throughout much of the South.73 The 5,500-mile Colonial Pipeline, which begins in Houston, Texas, also passes through Louisiana and carries about 2.4 million barrels per day of petroleum products to 11 other states before it ends in Linden, New Jersey.74 Louisiana's refineries also supply the state's industrial sector with petroleum product feedstocks, particularly to the petrochemical industry. The large concentration of petrochemical manufacturing facilities in the state contributes to Louisiana ranking third in total petroleum use and first in per capita consumption of petroleum among the states.75,76 About 2 out of 100 state households rely on propane, fuel oil, or kerosene for home heating.77
Coal
New Orleans is the nation’s third-largest coal exporting port.
Louisiana's recoverable coal reserves are small, and account for 0.1% of the U.S. total.78 In 2023, the state's one coal mine produced 289,000 tons of low-grade lignite, or about 0.1%, of total U.S. coal output.79 Louisiana plays a bigger role in transporting U.S. coal, as New Orleans is the nation's third-largest coal exporting port. Most of the exported coal comes from other states. In 2024, the port of New Orleans handled about 14% of U.S. coal exports.80 Almost all the coal consumed in Louisiana is used for power generation, and about 95% of that coal comes from out of state. Nearly all the out-of-state coal delivered to Louisiana's coal-fired power plants arrives by rail from Wyoming. A small amount of the coal consumed in Louisiana also comes by barge down the Mississippi River from Illinois.81
Electricity
In 2024, natural gas accounted for about 76% of the state's electricity net generation.82 Natural gas fuels 8 of Louisiana's 10 largest power plants by generation.83 In 2024, Louisiana ranked fifth in the nation in the share of electricity generated from natural gas.84
Louisiana's two nuclear power plants, which are both located along the Mississippi River, accounted for 15% of the state's net generation in 2024.85,86 The Waterford 3 nuclear power plant is the second-largest power plant in the state by generation.87,88
In 2024, coal fueled about 4% of the state's generation, down from 18% a decade before.89 Louisiana's second largest generating plant, in terms of capacity, is coal-fired.90 Biomass, solar energy, and hydropower together accounted for a little more than 4% of Louisiana's total electricity generation in 2024.91
Louisiana has the highest per capita residential sector electricity consumption of any state.
Louisiana ranks third among the states with the highest total electricity consumption on a per capita basis.92 In 2024, the industrial sector consumed the most electricity in Louisiana, accounting for about 44% of the state total, followed by the residential sector at 32% and the commercial sector at 24%.93 Louisiana has the highest residential sector per capita electricity consumption in the nation.94 About 6 in 10 state households rely on electricity for home heating and almost all households have air conditioning.95,96
In June 2025, Louisiana had 275 public electric vehicle charging locations, most of which are in and around New Orleans and Baton Rouge.97,98
Renewable energy
In 2024, renewable energy sources provided 4% of Louisiana's total electricity net generation. Biomass resources are abundant in Louisiana, and wood and wood waste accounted for nearly half of the state's renewable electricity generation.99,100 The state's wood waste and sugarcane residues also provide ample feedstock for the state's two wood pellet manufacturing plants, which have a combined production capacity of about 1.3 million tons per year. Some of these wood pellets are exported to other countries, where they are burned at power plants to generate electricity.101,102
In 2024, solar power surpassed hydropower for the first time, providing 37% of Louisiana’s renewable generation.
In 2024, solar power in Louisiana, from both utility-scale (1 megawatt or larger) and small-scale, customer-sited solar panel electric generating systems (less than 1 megawatt), surpassed hydropower for the first time, providing 37% of the state's renewable generation. Louisiana's utility-scale solar generation was four times greater in 2024 than in 2023, after five solar farms with a total capacity of 708 megawatts came online.103,104 Louisiana has 13 utility-scale solar farms, mostly located in the southern part of the state.105 The 300-megawatt Oxbow Solar Farm is currently the largest in the state. Eleven new solar farms are scheduled to come online by 2026, adding almost 700 megawatts in generating capacity.106,107
Hydroelectric power accounted for 17% of Louisiana's in-state renewable electricity in 2024.108 The state's one utility-scale hydropower plant—the 192-megawatt Sidney A. Murray Jr. Hydroelectric Station—was the world's largest prefabricated power plant when it came online in 1990. Located on the Mississippi River, the plant has eight turbines.109,110
Louisiana has little onshore wind energy resource potential and no utility-scale wind power generating facilities.111,112 The state has greater offshore wind potential, and in 2023, the U.S. Bureau of Ocean Management awarded a development lease in the Lake Charles Lease area.113,114 In January 2025, the federal government halted this development with its pause to federal offshore wind leasing.115
Louisiana does not have a Renewable Portfolio Standard that requires a certain amount of the state's electricity generation or electricity sales come from renewable energy sources.116 However, Louisiana has policies to encourage the use of renewable energy and energy efficiency, including voluntary electric utility efficiency programs, energy standards for public buildings, and net metering.117,118,119 Small-scale, customer-sited generating installations of up to 25 kilowatts for residential systems and up to 300 kilowatts for commercial and agricultural systems that use solar PV, wind, biomass, and other renewable technologies are eligible to receive a credit on their utility bills for the excess electricity they put on the grid.120
Endnotes
1 U.S. Department of Interior, U.S. Geological Survey, Assessment of Undiscovered Conventional Oil and Gas Resources in the Norphlet Formation, U.S. Gulf Coast Region, 2023 (October 2024), Fact Sheet 2024-3034, p. 1.
2 WorldAtlas, Maps of Louisiana, updated January 30, 2024.
3 U.S. Energy Information Administration (EIA), State Energy Data System, Profile Data, Louisiana, Reserves, updated July 17, 2024.
4 National Renewable Energy Laboratory, Biomass Resource Data, Tools, and Maps, U.S. Biomass Resource Maps (January 15, 2014).
5 Louisiana Economic Development, Wood, Crops and Waste Products Offer Renewable Energy Sources, accessed July 24, 2025.
6 Keim, Barry, "Louisiana-The Wettest State in the Contiguous United States," Community Collaborative Rain, Hail and Snow Network, accessed July 24, 2025.
7 Louisiana Economic Development, Natural Resources, accessed July 24, 2025.
8 U.S. Department of Agriculture, 2022 Census of Agriculture State Profile, Louisiana.
9 Louisiana State University, Ag Center, Environment & Natural Resources, Forestry, accessed July 24, 2025.
10 U.S. EIA, State Energy Data System, Table C11, Total Energy Consumption Estimates by End-Use Sector, Ranked by State, 2023.
11 U.S. EIA, State Energy Data System, Table C14, Total Energy Consumption Estimates per Capita by End-Use Sector, Ranked by State, 2023.
12 NETSTATE, Louisiana, Louisiana Economy, accessed July 24, 2025.
13 U.S. EIA, State Energy Data System, Table C11, Energy Consumption Estimates by End-Use Sector, Ranked by State, 2023.
14 North Carolina Institute for Climate Studies, NOAA National Centers for Environmental Information, State Climate Summaries 2022, Louisiana.
15 U.S. EIA, Residential Energy Consumption Survey (2020), State Data, Housing Characteristics, Highlights for space heating in U.S. homes by state, 2020, and Highlights for air conditioning in U.S. homes by state, 2020.
16 U.S. EIA, State Energy Data System, Table C11, Total Energy Consumption Estimates by End-Use Sector, Ranked by State, 2023.
17 U.S. EIA, Natural Gas Gross Withdrawals and Production, Marketed Production, Annual-Million Cubic Feet, 2019-24.
18 U.S. EIA, U.S. Crude Oil and Natural Gas Proved Reserves, Year-end 2023 (June 25, 2025), Table 8, Natural gas, wet after lease separation, proved reserves, reserves changes, by state and areas, 2023.
19 U.S. EIA, "U.S. natural gas production remained flat in 2024," Today in Energy (April 17, 2025).
20 U.S. EIA, Drilling Productivity Report (May 13, 2024), Production by Region.
21 U.S. EIA, Natural Gas Consumption by End Use, Louisiana, Annual, 2019-24.
22 U.S. EIA, Natural Gas Consumption by End Use, Pipeline and Distribution Use, Annual, 2019-24.
23 U.S. EIA, State Energy Data System, Table C16, Natural Gas Consumption Estimates, Total and per Capita, Ranked by State, 2023.
24 U.S. EIA, Natural Gas Consumption by End Use, Louisiana, Annual, 2019-24.
25 U.S. Census Bureau, Tables, Table B25040, House Heating Fuel, Louisiana, 2023 American Community Survey 1-Year Estimates.
26 North Carolina Institute for Climate Studies, NOAA National Centers for Environmental Information, State Climate Summaries 2022, Louisiana.
27 U.S. EIA, Natural Gas Consumption by End Use, Louisiana, Annual, 2019-24.
28 U.S. EIA, Energy Atlas, Natural Gas Infrastructure and Resources, National Gas Pipelines, accessed July 23, 2025.
29 American Gas Association, , Table 5-3, Gas Industry Miles of Pipeline and Main by State and Type, 2023.
30 U.S. EIA, International and Interstate Movements of Natural Gas by State, Louisiana, Annual, 2018-23.
31 U.S. EIA, U.S. Energy Atlas, Natural Gas Interstate and Intrastate Pipelines, updated October 21, 2020.
32 CME Group, Understanding Henry Hub, accessed Julye 24, 2025.
33 "How to Understand The Henry Hub Chart?," Slattery Energy Group (November 12, 2021).
34 S&P Global, Price Assessment, Henry Hub Gas Price Assessment, accessed July 24, 2025.
35 U.S. EIA, International and Interstate Movements of Natural Gas by State, Louisiana, Annual, 2018-23.
36 U.S. EIA, "The eighth U.S. liquefied natural gas export terminal, Plaquemines LNG, ships first cargo," Today in Energy (January 13, 2025).
37 U.S. EIA, "The United States remained the world's largest liquefied natural gas exporter in 2024," Today in Energy (March 27, 2025).
38 U.S. EIA, U.S. Natural Gas Exports and Re-Exports by Point of Exit (Million Cubic Feet), Area, Cameron, LA, Cameron (Calcasieu Pass), LA, Plaquemines, LA, and Sabine Pass, LA, Annual, 2019-24.
39 U.S. EIA, "How will the start-up timing of the new U.S. LNG export facilities affect our forecast?," Today in Energy (April 3, 2025).
40 U.S. EIA, Underground Natural Gas Storage Capacity, Total Number of Existing Fields, Annual, 2018-23, and Total Storage Capacity (Million Cubic Feet), Annual, 2018-23.
41 U.S. EIA, "U.S. natural gas consumption has both winter and summer peaks," Today in Energy (February 13, 2020).
42 U.S. EIA, "U.S. natural gas consumption set new winter and summer monthly records in 2024," Today in Energy (March 31, 2025).
43 U.S. EIA, Louisiana Natural Gas Underground Storage Net Withdrawals, Million Cubic Feet, Monthly, 1990-2025.
44 U.S. EIA, U.S. Crude Oil and Natural Gas Proved Reserves, Year-end 2023 (June 25, 2025), Table 6, Crude oil and lease condensate proved reserves, reserves changes, by states and areas, 2023.
45 U.S. EIA, Crude Oil Production, Annual-Thousand Barrels per Day, 2019-24.
46 U.S. EIA, Louisiana Field Production of Crude Oil, Annual, Thousand Barrels per Day, 1981-2024.
47 U.S. EIA, State Energy Data System, Table PT1, Primary Energy Production Estimates in Physical Units, Louisiana, 1960-2023.
48 Louisiana Oil & Gas Association, The History of Louisiana's Oil & Gas Industry, Jennings Field, accessed July 17, 2025.
49 National Commission on the BP Deepwater Horizon Oil Spill and Offshore Drilling, Staff Working Paper No. 1, Draft, A Brief History of Offshore Oil Drilling, p. 2, accessed July 17, 2025.
50 U.S. EIA, Gulf Coast (PADD 3) Field Production of Crude Oil (Thousand Barrels), 2017-24.
51 U.S. EIA, U.S. Crude Oil and Natural Gas Proved Reserves, Year-end 2023 (June 25, 2025), Table 6, Crude oil and lease condensate proved reserves, reserves changes, by states and areas, 2023.
52 U.S. EIA, Top 100 U.S. Oil and Gas Fields (March 2015), p. 5-7.
53 U.S. EIA, Louisiana Profile Overview, Interactive Map, Layer List: Pipelines and Transmission, Crude Oil Pipelines, accessed July 17, 2025.
54 U.S. EIA, Crude Imports, Imports of all grades to Total U.S. 2024, Origin by Country, Destination by State, All grades (thousand barrels), 2009-24.
55 LOOP, LLC, A Strategic Crude Oil Hub - Linking energy producers to global refineries, p. 3, 7, accessed July 31, 2025.
56 LOOP, LLC, About, History, accessed July 18, 2025.
57 LOOP, LLC, Customers, Services, Cavern Storage, and Tank Storage, accessed July 18, 2025.
58 LOOP, LLC, Customers, Distribution Information, accessed July 18, 2025.
59 LOOP, LLC, Customers, Services, Vessel Loading, accessed July 18, 2025.
60 U.S. EIA, "Oil tanker sizes range from general purpose to ultra-large crude carriers on AFRA scale," Today in Energy (September 16, 2014).
61 U.S. Department of Energy, Office of Fossil Energy, Strategic Petroleum Reserve, SPR Storage Sites, accessed July 18, 2025.
62 U.S. EIA, U.S. Weekly U.S. Ending Stocks of Crude Oil in SPR (Thousand Barrels), July 15, 2025.
63 U.S. EIA, Number and Capacity of Petroleum Refineries, Number of Operating Refineries, Annual (as of January 1), 2020-25.
64 U.S. EIA, Number and Capacity of Petroleum Refineries, Atmospheric Crude Oil Distillation Operable Capacity (B/CD), Annual (as of January 1), 2020-25.
65 U.S. EIA, Oil and petroleum products explained, Refining crude oil, Top 10 U.S. refineries operable capacity, updated June 17, 2023.
66 U.S. EIA, Energy Atlas, Petroleum Refineries, updated October 31, 2024.
67 U.S. EIA, "Refining industry risks from 2025 hurricane season," Today in Energy (May 20, 2025).
68 "Louisiana (U.S.) oil refineries start recovering from Hurricane Francine," Hydrocarbon Processing (September 13, 2024).
69 "The Bayou Boom: Louisiana Reaps Benefits of Affordable Energy," Institute for Energy Research (May 31, 2013).
70 Louisiana, Department of Natural Resources, Louisiana Crude Oil Refinery Survey Report 2021 (June 2022), Figure 5, p. 16.
71 U.S. EIA, "Canada's crude oil has an increasingly significant role in U.S. refineries," Today in Energy (August 1, 2024).
72 The Louisiana Mid-Continent Oil & Gas Association (LMOGA), The Economic Impact of the Oil and Natural Gas Industry in Louisiana (October 5, 2020), p. 11-13.
73 Kinder Morgan, Products Home Page, Products Pipeline, Southeast Refined Products, Products (SE) SE Pipe Line Corporation, accessed July 22, 2025.
74 Colonial Pipeline Company, System Map, and About Us, accessed July 31, 2025.
75 The Louisiana Mid-Continent Oil & Gas Association (LMOGA), The Economic Impact of the Oil and Natural Gas Industry in Louisiana (October 5, 2020), p. 11-12.
76 U.S. EIA, State Energy Data System, Table C15, Petroleum Consumption Estimates, Total and per Capita, Ranked by State, 2023.
77 U.S. Census Bureau, Tables, Table B25040, House Heating Fuel, Louisiana, 2023 American Community Survey 1-Year Estimates.
78 U.S. EIA, U.S. Coal Reserves (October 30, 2024), Table 15, Recoverable Coal Reserves at Producing Mines, Estimated Recoverable Reserves, and Demonstrated Reserve Base by Mining Method, 2023.
79 U.S. EIA, Annual Coal Report (October 30, 2024), Table 6, Coal Production and Number of Mines by State and Coal Rank, 2023.
80 U.S. EIA, Quarterly Coal Report, Previous reports, 4th Quarter 2024 (April 2025) Table 13, U.S. Coal Exports by Customs District (short tons), 2024.
81 U.S. EIA, Annual Coal Distribution Report (October 30, 2024), Domestic distribution of U.S. coal by: Destination State, consumer, destination and method of transportation, Louisiana, Table DS-16, Domestic Coal Distribution, by Destination State, 2023.
82 U.S. EIA, Electricity Data Browser, Net generation for all sectors (thousand megawatthours), Louisiana, Annual, 2001-24.
83 U.S. EIA, Louisiana Electricity Profile 2023, Table 2B, available in XLSX format.
84 U.S. EIA, Electric Power Monthly (February 2025), Table 1.7.B, Table 1.3.B.
85 Entergy Corporation, River Bend Station, and Waterford 3, accessed July 31, 2025.
86 U.S. EIA, Electricity Data Browser, Net generation for all sectors (thousand megawatthours), Louisiana, Annual, 2001-24.
87 U.S. Nuclear Regulatory Commission, Facility Locator, Facilities by NRC Region or State, Louisiana, updated March 9, 2021.
88 U.S. EIA, Louisiana Electricity Profile 2023, Table 2B, available in XLSX format.
89 U.S. EIA, Electricity Data Browser, Net generation for all sectors (thousand megawatthours), Louisiana, Annual, 2001-24.
90 U.S. EIA, Louisiana Electricity Profile 2023, Table 2A, available in XLSX format.
91 U.S. EIA, Electricity Data Browser, Net generation for all sectors (thousand megawatthours), Louisiana, Annual, 2001-24.
92 U.S. EIA, State Energy Data System, Table C17, Electricity Sales to Ultimate Customers, Total and Residential, Total and per Capita, Ranked by State, 2023.
93 U.S. EIA, Electricity Data Browser, Retail sales of electricity (million kilowatthours), Louisiana, Annual, 2001-24.
94 U.S. EIA, State Energy Data System, Table C17, Electricity Sales to Ultimate Customers, Total and Residential, Total and per Capita, Ranked by State, 2023.
95 U.S. Census Bureau, Tables, Table B25040, House Heating Fuel, Louisiana, 2023 American Community Survey 1-Year Estimates.
96 U.S. EIA, Residential Energy Consumption Survey (2020), State Data, Housing Characteristics, Highlights for air conditioning in U.S. homes by state, 2020.
97 U.S. EIA, Monthly Energy Review (July 2025), Appendix F monthly state file, XLS, Public Ports only and Public & Private Ports combined.
98 U.S. Department of Energy, Alternative Fuels Data Center, Alternative Fueling Station Finder, Louisiana, accessed July 16, 2025.
99 Louisiana Economic Development, Wood, Crops and Waste Products Offer Renewable Energy Sources, accessed July 31, 2025.
100 U.S. EIA, Electricity Data Browser, Net generation for all sectors (thousand megawatthours), Louisiana, Annual, 2001-24.
101 U.S. EIA, Monthly Densified Biomass Fuel Report (July 10, 2025), Table 1, Densified Biomass Fuel Manufacturing Facilities in the United States by State, Region, and Capacity, March 2025.
102 Guo, Jinggang, Timber Market Outlook in Louisiana (January 10, 2024), 2024 Louisiana Agricultural Outlook Forum, p. 12.
103 U.S. EIA, Electricity Data Browser, Net generation for all sectors (thousand megawatthours), Louisiana, Annual, 2001-24.
104 U.S. EIA, Preliminary Monthly Electric Generator Inventory (based on Form EIA-860M as a supplement to Form EIA-860), Inventory of Operating Generators as of June 2025, Plant State: Louisiana, Technology: Solar Photovoltaic.
105 U.S. EIA, Electricity Data Browser, List of plants for solar, Louisiana, all sectors, 2024.
106 U.S. EIA, Preliminary Monthly Electric Generator Inventory (based on Form EIA-860M as a supplement to Form EIA-860), Inventory of Operating Generators as of June 2025, and Planned Generators as of June 2025, Plant State: Louisiana, Technology: Solar Photovoltaic.
107 Lightsource BP Renewable Energy Investments Ltd., Oxbow Solar 345MW in Louisiana, accessed July 16, 2025.
108 U.S. EIA, Electricity Data Browser, Net generation for all sectors (thousand megawatthours), Louisiana, Annual, 2001-24.
109 U.S. EIA, Preliminary Monthly Electric Generator Inventory (based on Form EIA-860M as a supplement to Form EIA-860), Inventory of Operating Generators as of June 2025, Plant State: Louisiana, Technology: Conventional Hydroelectric.
110 The Historical Market Database, Sidney A. Murray, Jr., Hydroelectric Station 1990, accessed July 16, 2025.
111 U.S. Department of Energy, Energy Efficiency and Renewable Energy, WINDExchange, Wind Energy in Louisiana, Maps & Data, accessed July 16, 2025.
112 U.S. EIA, Preliminary Monthly Electric Generator Inventory (based on Form EIA-860M as a supplement to Form EIA-860), Inventory of Operating Generators as of June 2025, Plant State: Louisiana, Technology: Onshore Wind Turbine.
113 U.S. Department of Energy, Energy Efficiency and Renewable Energy, WINDExchange, Wind Energy in Louisiana, Maps & Data, accessed July 31, 2025.
114 Bureau of Ocean Energy Management, Gulf of America Wind Auction 1, accessed July 16, 2025.
115 The White House, "Temporary Withdrawal of All Areas on the Outer Continental Shelf from Offshore Wind Leasing and Review of the Federal Government's Leasing and Permitting Practices for Wind Projects," Presidential Action (January 20, 2025)
116 NC Clean Energy Technology Center, DSIRE, Louisiana, Renewable Energy Pilot Program, updated July 20, 2023.
117 NC Clean Energy Technology Center, DSIRE, Louisiana, Programs, accessed July 15, 2025.
118 NC Clean Energy Technology Center, DSIRE, Louisiana, Energy Reduction in Major State Facilities, updated June 27, 2024.
119 NC Clean Energy Technology Center, DSIRE, Louisiana, Net Metering, updated March 24, 2025.
120 NC Clean Energy Technology Center, DSIRE, Louisiana, Net Metering, updated March 24, 2025.
Other Resources
Energy-Related Regions and Organizations
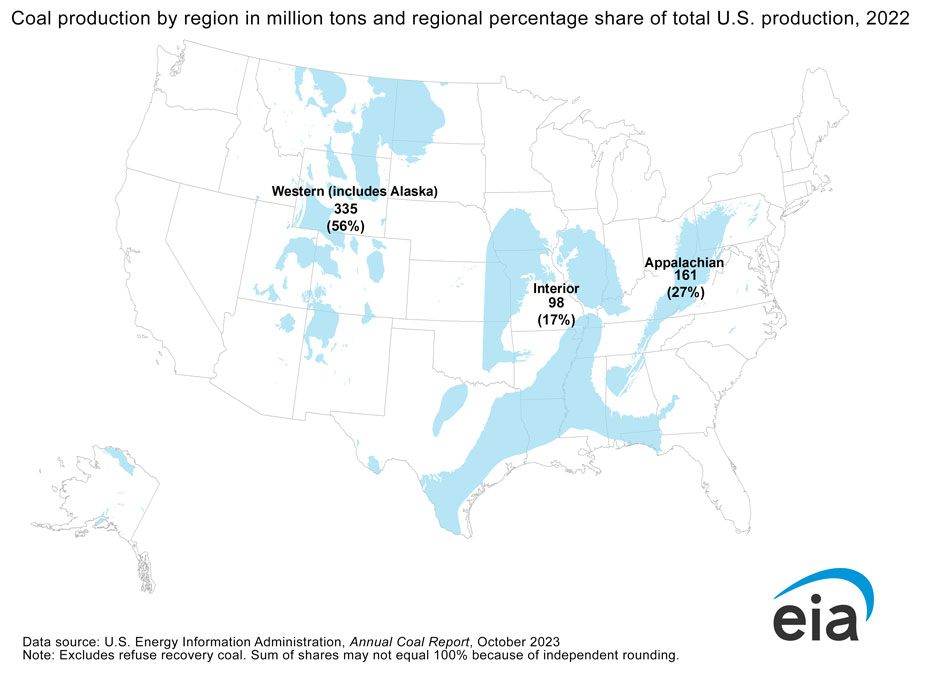
- Coal Region: Interior
- Petroleum Administration for Defense District (PADD): 3
- Regional Transmission Organization (RTO) and Independent System Operator (ISO): Midcontinent Independent System Operator (MISO), Southwest Power Pool (SPP)
- North American Electric Reliability Corporation (NERC) ERO Enterprise: Regional Entities: Midwest Reliability Organization (MRO), SERC Reliability Corporation (SERC)