Arizona Quick Facts
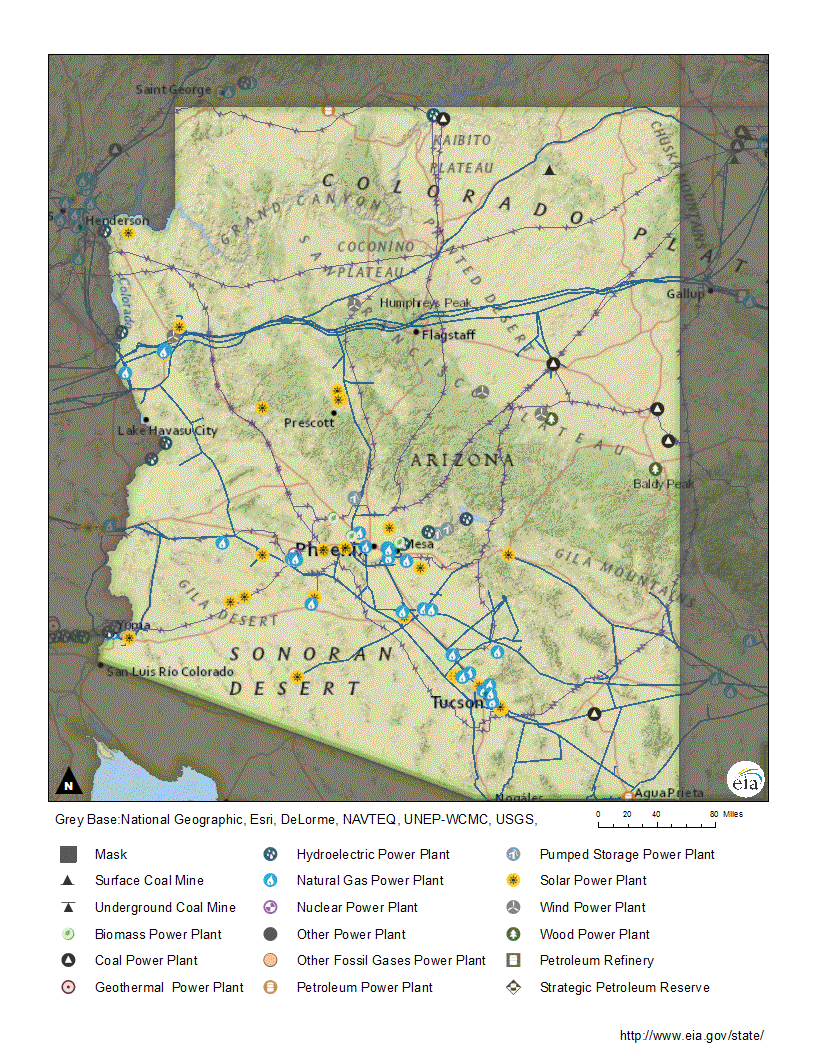
- Arizona's Palo Verde Nuclear Generating Station is the second-largest nuclear power plant in the nation. In 2023, it accounted for 4% of the nation's nuclear generation and 27% of Arizona's total net generation from all sources.
- Arizona ranks among the top five states in the nation in total solar-powered generating capacity from both utility- and small-scale installations, with more than 6,100 megawatts.
- Per capita energy consumption in Arizona is less than almost four-fifths of the states. This is partly due to the mild winter climate, which draws many seasonal residents, with almost 1 in 17 Arizona homes occupied only part of the year.
- In 2023, Arizona's total in-state electricity was generated mainly from 6 sources: natural gas (46%), nuclear power (27%), coal (10%), solar energy (10%), hydroelectric power (5%), and wind (1%).
- In 2023, hydroelectric power plants accounted for about 5% of Arizona's total in-state electricity generation due to ongoing drought conditions.
Last Updated: June 20, 2024
Data
Last Update: September 19, 2024 | Next Update: October 17, 2024
| Prices | |||||
|---|---|---|---|---|---|
| Petroleum | Arizona | U.S. Average | Period | find more | |
| Domestic Crude Oil First Purchase | -- | $ 77.45 /barrel | Jun-24 | ||
| Natural Gas | Arizona | U.S. Average | Period | find more | |
| City Gate | $ 1.98 /thousand cu ft | $ 4.36 /thousand cu ft | Jun-24 | find more | |
| Residential | $ 26.27 /thousand cu ft | $ 21.10 /thousand cu ft | Jun-24 | find more | |
| Coal | Arizona | U.S. Average | Period | find more | |
| Average Sales Price | -- | $ 54.46 /short ton | 2022 | ||
| Delivered to Electric Power Sector | $ 3.24 /million Btu | $ 2.51 /million Btu | Jun-24 | ||
| Electricity | Arizona | U.S. Average | Period | find more | |
| Residential | 15.14 cents/kWh | 16.41 cents/kWh | Jun-24 | find more | |
| Commercial | 12.94 cents/kWh | 13.10 cents/kWh | Jun-24 | find more | |
| Industrial | 8.11 cents/kWh | 8.44 cents/kWh | Jun-24 | find more | |
| Reserves | |||||
|---|---|---|---|---|---|
| Reserves | Arizona | Share of U.S. | Period | find more | |
| Crude Oil (as of Dec. 31) | -- | -- | 2022 | find more | |
| Expected Future Production of Dry Natural Gas (as of Dec. 31) | -- | -- | 2022 | find more | |
| Expected Future Production of Natural Gas Plant Liquids | -- | -- | 2022 | find more | |
| Recoverable Coal at Producing Mines | -- | -- | 2022 | find more | |
| Rotary Rigs & Wells | Arizona | Share of U.S. | Period | find more | |
| Natural Gas Producing Wells | NA | NA | 2020 | find more | |
| Capacity | Arizona | Share of U.S. | Period | ||
| Crude Oil Refinery Capacity (as of Jan. 1) | 0 barrels/calendar day | 0.0% | 2023 | ||
| Electric Power Industry Net Summer Capacity | 31,456 MW | 2.6% | Jun-24 | ||
| Supply & Distribution | |||||
|---|---|---|---|---|---|
| Production | Arizona | Share of U.S. | Period | find more | |
| Total Energy | 408 trillion Btu | 0.4% | 2022 | find more | |
| Crude Oil | 0 thousand barrels per day | 0.0% | Jun-24 | find more | |
| Natural Gas - Marketed | 198 million cu ft | * | 2022 | find more | |
| Coal | -- | -- | 2022 | find more | |
| Total Utility-Scale Net Electricity Generation | Arizona | Share of U.S. | Period | find more | |
| Total Net Electricity Generation | 10,817 thousand MWh | 2.8% | Jun-24 | ||
| Utility-Scale Net Electricity Generation (share of total) | Arizona | U.S. Average | Period | ||
| Petroleum-Fired | * | 0.4 % | Jun-24 | find more | |
| Natural Gas-Fired | 47.9 % | 43.3 % | Jun-24 | find more | |
| Coal-Fired | 7.3 % | 15.8 % | Jun-24 | find more | |
| Nuclear | 26.3 % | 17.5 % | Jun-24 | find more | |
| Renewables | 18.2 % | 22.7 % | Jun-24 | ||
| Stocks | Arizona | Share of U.S. | Period | find more | |
| Motor Gasoline (Excludes Pipelines) | 72 thousand barrels | 0.6% | Jun-24 | ||
| Distillate Fuel Oil (Excludes Pipelines) | 639 thousand barrels | 0.7% | Jun-24 | find more | |
| Natural Gas in Underground Storage | -- | -- | Jun-24 | find more | |
| Petroleum Stocks at Electric Power Producers | 134 thousand barrels | 0.6% | Jun-24 | find more | |
| Coal Stocks at Electric Power Producers | 3,816 thousand tons | 2.9% | Jun-24 | find more | |
| Fueling Stations | Arizona | Share of U.S. | Period | ||
| Motor Gasoline | 1,612 stations | 1.5% | 2022 | ||
| Propane | 68 stations | 2.8% | Aug-24 | ||
| Electric Vehicle Charging Locations | 1,250 stations | 1.9% | Aug-24 | ||
| E85 | 19 stations | 0.4% | Aug-24 | ||
| Biodiesel, Compressed Natural Gas, and Other Alternative Fuels | 14 stations | 0.5% | Aug-24 | ||
| Consumption & Expenditures | |||||
|---|---|---|---|---|---|
| Summary | Arizona | U.S. Rank | Period | ||
| Total Consumption | 1,527 trillion Btu | 23 | 2022 | find more | |
| Total Consumption per Capita | 207 million Btu | 40 | 2022 | find more | |
| Total Expenditures | $ 32,961 million | 18 | 2022 | find more | |
| Total Expenditures per Capita | $ 4,475 | 42 | 2022 | find more | |
| by End-Use Sector | Arizona | Share of U.S. | Period | ||
| Consumption | |||||
| » Residential | 404 trillion Btu | 2.1% | 2022 | find more | |
| » Commercial | 337 trillion Btu | 2.0% | 2022 | find more | |
| » Industrial | 219 trillion Btu | 0.7% | 2022 | find more | |
| » Transportation | 567 trillion Btu | 2.1% | 2022 | find more | |
| Expenditures | |||||
| » Residential | $ 5,942 million | 1.8% | 2022 | find more | |
| » Commercial | $ 4,408 million | 1.8% | 2022 | find more | |
| » Industrial | $ 3,149 million | 1.1% | 2022 | find more | |
| » Transportation | $ 19,462 million | 2.3% | 2022 | find more | |
| by Source | Arizona | Share of U.S. | Period | ||
| Consumption | |||||
| » Petroleum | 120 million barrels | 1.6% | 2022 | find more | |
| » Natural Gas | 454 billion cu ft | 1.4% | 2022 | find more | |
| » Coal | 8,412 thousand short tons | 1.6% | 2022 | find more | |
| Expenditures | |||||
| » Petroleum | $ 22,079 million | 2.1% | 2022 | find more | |
| » Natural Gas | $ 4,246 million | 1.6% | 2022 | find more | |
| » Coal | $ 442 million | 1.7% | 2022 | find more | |
| Consumption for Electricity Generation | Arizona | Share of U.S. | Period | find more | |
| Petroleum | 5 thousand barrels | 0.3% | Jun-24 | find more | |
| Natural Gas | 39,612 million cu ft | 3.1% | Jun-24 | find more | |
| Coal | 503 thousand tons | 1.5% | Jun-24 | find more | |
| Energy Source Used for Home Heating (share of households) | Arizona | U.S. Average | Period | ||
| Natural Gas | 32.9 % | 46.2 % | 2022 | ||
| Fuel Oil | 0.1 % | 3.9 % | 2022 | ||
| Electricity | 60.2 % | 41.3 % | 2022 | ||
| Propane | 2.9 % | 5.0 % | 2022 | ||
| Other/None | 3.9 % | 3.5 % | 2022 | ||
| Environment | |||||
|---|---|---|---|---|---|
| Renewable Energy Capacity | Arizona | Share of U.S. | Period | find more | |
| Total Renewable Energy Electricity Net Summer Capacity | 8,034 MW | 2.3% | Jun-24 | ||
| Ethanol Plant Nameplate Capacity | 0 million gal/year | 0.0% | 2024 | ||
| Renewable Energy Production | Arizona | Share of U.S. | Period | find more | |
| Utility-Scale Hydroelectric Net Electricity Generation | 536 thousand MWh | 2.5% | Jun-24 | ||
| Utility-Scale Solar, Wind, and Geothermal Net Electricity Generation | 1,314 thousand MWh | 2.1% | Jun-24 | ||
| Utility-Scale Biomass Net Electricity Generation | 16 thousand MWh | 0.4% | Jun-24 | ||
| Small-Scale Solar Photovoltaic Generation | 519 thousand MWh | 6.0% | Jun-24 | ||
| Fuel Ethanol Production | 0 thousand barrels | 0.0% | 2022 | ||
| Renewable Energy Consumption | Arizona | U.S. Rank | Period | find more | |
| Renewable Energy Consumption as a Share of State Total | 6.7 % | 31 | 2022 | ||
| Fuel Ethanol Consumption | 7,458 thousand barrels | 16 | 2022 | ||
| Total Emissions | Arizona | Share of U.S. | Period | find more | |
| Carbon Dioxide | 83.0 million metric tons | 1.7% | 2021 | ||
| Electric Power Industry Emissions | Arizona | Share of U.S. | Period | find more | |
| Carbon Dioxide | 32,948 thousand metric tons | 2.0% | 2022 | ||
| Sulfur Dioxide | 7 thousand metric tons | 0.6% | 2022 | ||
| Nitrogen Oxide | 23 thousand metric tons | 1.9% | 2022 | ||
Analysis
Last Updated: June 20, 2024
Overview
Per capita energy consumption in Arizona is less than in almost four-fifths of the states.
Arizona is known for its stunning landscapes and natural wonders from the Grand Canyon in the north to the Saguaro deserts in the south.1 The state has few fossil fuel reserves, but it does have abundant renewable energy resources.2,3,4,5 Although higher elevations receive greater amounts of precipitation, including significant snowfalls, most of Arizona is semiarid or arid, and plentiful sunshine gives the entire state some of the nation's greatest solar energy resources.6,7,8 Elevations in Arizona vary from peaks more than 12,000 feet high in the north to nearly sea level in the deserts in the southwest. Some of the highest elevations and greatest wind potential in the state are on the Colorado Plateau just north of the 200-mile-long Mogollon Rim, which cuts diagonally across central Arizona from northwest to southeast and marks the southern edge of the Plateau.9,10 Even though it is arid, the state has biomass resources. More than one-fourth of Arizona is forested.11,12 Arizona also has major hydroelectric facilities, including Hoover Dam and Glen Canyon Dam, the two highest concrete-arch dams in the United States.13
Arizona's minerals drew Spanish explorers seeking gold, silver, and copper as early as the late 1500s.14 About two-fifths of the state's surface acreage and nearly half of Arizona's minerals acreage is administered by the federal government.15 Arizona still produces more copper than any other state, accounting for about 70% of the nation's output in 2022.16,17 Arizona is also the site of major uranium reserves, including the highest-grade uranium in the nation.18 After years of no uranium mining in the state, the Pinyon Plain Mine—formerly known as Canyon Mine— resumed operations in December 2023 due to the rise in uranium prices and U.S. ban of uranium imports from Russia.19,20,21 Mining has long been a significant contributor to the state's wealth. However, Arizona's economy has diversified. Real estate; government; professional and business services; finance and insurance; utilities; and health care services are today among the largest contributors to the state's gross domestic product (GDP).22 Other key industries in the state include computer and electronic products manufacturing; aerospace and defense; and biosciences.23
Overall, Arizona's total per capita energy consumption is less than in almost four-fifths of the states.24 In 2021, the transportation sector accounted for 36% of Arizona's total energy consumption, the residential sector used 27%, the commercial sector accounted for 22%, and the state's industrial sector consumed 15%.25 The majority of Arizona's residents live in a few large urban areas, leaving most of the state lightly populated.26 Mild summers in the north and mild winters in the south make Arizona a popular vacation and retirement destination, and the state's year-round population grew faster than in all but four other states in 2023.27,28 The pleasant weather also draws many seasonal residents, and almost 1 in 17 Arizona homes were occupied only part of the year in 2022.29,30,31
Electricity
Arizona’s Palo Verde Nuclear Generating Station is the nation’s second-largest nuclear power plant.
Natural gas is the primary fuel used for electricity generation in Arizona. Natural gas-fired power plants provided 46% of Arizona's total in-state electricity net generation in 2023.32 Although 5 of the state's 10 largest power plants by capacity and 7 of the 10 largest by generation are natural gas-fired, the Palo Verde Nuclear Generating Station is Arizona's largest power plant and the nation's second-largest nuclear power plant after the Vogtle plant in Georgia.33,34 In 2023, Palo Verde's three operating reactors supplied 27% of the state's net generation, and it accounted for 4% of the nation's nuclear generation. Until 2016, coal fueled about as much or more of the state's electricity generation as nuclear power.35,36 Some coal-fired power plants have switched to natural gas and the Navajo Generating Station, which was the largest coal-fired facility in the state and Arizona's second-largest power plant, permanently closed in late 2019.37,38,39 In 2023, coal fueled 10% of the state's total net generation, down from 38% in 2013. Renewable resources, mostly solar and hydroelectric power, supplied almost all the rest of Arizona's in-state electricity generation in 2023.40
Some of Arizona's in-state generating capacity was developed to power the crucial pumping systems that bring water for drinking and irrigation from the Colorado River in the north to the drier central and southern parts of Arizona, where most of the state's population lives.41,42 However, Arizona power plants typically generate more electricity than the state consumes, and almost one-fifth of the electricity generated in-state is sent over the regional grid to consumers outside of Arizona.43 Because interstate transmission lines have become congested during peak demand periods, Arizona continues to work with other states and stakeholders to improve transmission capacity.44 Projects in development include one that will transmit electricity from carbon-free sources (renewable and nuclear energy) in Arizona and New Mexico to consumers across the southwest.45,46 Another project will bring wind power from Wyoming to population centers in the southwestern states, including Arizona, and will send solar power from the southwest to the Rocky Mountain states.47 A third transmission project in development will connect areas of southeastern California to southwestern Arizona, facilitating renewable energy development along the route.48 Arizona also has 923 megawatts of battery energy storage systems (BESS), with an additional 2,000 megawatts planned to come online in by 2025.49 BESS are an option for adding power in remote rural communities and storing energy generated by renewable sources.50 Batteries deployed in BESS currently use lithium and Arizona has some lithium deposits.51 An open-pit lithium mining project, Big Sandy, is in development in northern Arizona.52
Arizona consumes more electricity than two-thirds of the states, but its total per capita electricity use is less than in three-fifths of the states.53 Arizona's residential sector, where about 3 in 5 households rely on electricity for home heating and more than 9 in 10 homes use air conditioning, consumes more electricity than the residential sectors in three-fourths of the states.54,55 In 2023, the residential and commercial sectors each accounted for 40% of Arizona's electricity sales and the industrial sector used 37%. Arizona's transportation sector used a small amount of electricity for public electric rail.56 In March 2024, Arizona had 1,191 public electric vehicle charging locations.57
Renewable energy
In 2023, electricity generated from renewable energy at both utility-scale (1 megawatt or larger) facilities and small-scale (less than 1 megawatt) solar panel systems provided about 17% of Arizona's total net generation. Three-fifths of that total came from solar photovoltaic (PV) and solar thermal energy. Hydroelectric power and wind energy supplied almost all the rest. Conventional hydroelectric power long dominated Arizona's renewable generation, but the contribution from utility- and small-scale solar-powered installations surpassed hydroelectric generation for the first time in 2017. In 2023, solar energy accounted for 10% of the state's total electricity net generation from all sources.58
Arizona ranks fifth among the states in solar-powered electricity generation, including from solar thermal and large- and small-scale solar PV facilities.
Arizona ranks among the top five states in the nation in total solar-powered generating capacity from both utility- and small-scale installations, with more than 6,100 megawatts.59 In 2023, it was fifth in solar-powered net generation, after California, Texas, Florida, and North Carolina. About three-fifths of the state's solar generation was from large-scale solar PV facilities and two-fifths was from small-scale solar PV installations, such as rooftop solar panels. The rest was from utility-scale solar thermal installations.60 Arizona is one of three states with electricity generation from utility-scale solar thermal technologies, which concentrate sunlight to heat fluids used to spin the turbines that generate electricity.61,62 The Solana Generating Station in Maricopa County is Arizona's only solar thermal power plant. It has a capacity of almost 300 megawatts. The state's largest solar PV facility, Agua Caliente solar farm in Yuma County, has a capacity of almost 350 megawatts.63
Hydroelectric power typically accounts for less than one-tenth of Arizona's total in-state net generation. In 2023, it supplied about 5%, in part because of the state's prolonged (almost 30-year) drought.64,65,66 Glen Canyon Dam and Hoover Dam, located on the Colorado River in northern Arizona, are among the 10 largest power plants by capacity in the state.67,68 They provide most of Arizona's in-state hydroelectric generation.69 Arizona is also one of 18 states with pumped storage hydroelectric generation.70 During periods of low power demand, which are usually at night, less costly electricity is used to pump water from a lower reservoir to an upper reservoir. Then, during periods when power demand and electricity prices are higher, usually during the day, the water is released from the upper reservoir and flows down through generating turbines on its way to the lower reservoir, producing electricity. Although the pumped storage plant uses more power than it generates, it supplies power in periods of peak demand when electricity prices are higher.71 The state's three pumped storage plants have a combined capacity of almost 220 megawatts.72,73
In 2023, Arizona's seven utility-scale wind farms provided less than 2% of the state's total electricity generation.74,75 The state is among the top 10 states in wind energy potential.76 The largest wind farm in Arizona came online in 2020 and has 350 megawatts of generating capacity.77 Two new wind projects located in Coconino County in north-central Arizona are expected to come online by the end of 2024, with a total generating capacity of almost 400 megawatts. One of these projects is phase two of the Chevelon Butte project, when completed will become Arizona's largest wind farm.78,79
Biomass fueled less than 0.2% of Arizona's power in 2023, almost all of it from the state's largest biomass-fueled power plant.80 Arizona biomass resources also provide feedstock for the state's one wood pellet manufacturing plant, which has an annual production capacity of about 80,000 tons.81 Wood pellets are used for power generation and space heating. About 1 in 60 Arizona households heat with wood.82,83
Arizona has some deep, high-temperature geothermal resources, particularly in the southeastern part of the state, but Arizona does not have any utility-scale geothermal power generation.84,85 However, the state's geothermal resources are used in several direct-use applications, including in an active aquaculture industry that uses geothermal resources to raise shrimp and fish and using geothermal heating for copper extraction. Arizona also has many hot springs that attract visitors to several resorts and spas in the state.86,87
Arizona adopted a renewable energy standard (RES) in 2006 that required regulated electric utilities source 15% of the electricity they sell from renewable resources by 2025.88 A portion of each year's required renewable energy target had to come from non-utility, customer-sited generation. In April 2024, Arizona regulators voted to repeal the RES.89
Petroleum
Arizona has no significant proved crude oil reserves, and the state's few oil wells produced only about 6,000 barrels of crude oil in 2023.90,91 The largest oil field in the state, the Dineh-bi-Keyah field, is on the Navajo reservation in the northeastern corner of Arizona.92 Helium, an important industrial gas, is produced from formations below the crude oil zones in that field in the Four Corners area and in the Holbrook Basin further south.93,94 Some areas in the state may have additional crude oil potential, but exploratory drilling has not yielded large finds, and much of Arizona remains unexplored.95
Arizona does not have any crude oil refineries.96 The state receives motor gasoline and other petroleum products by pipeline from southern California and from Texas.97 In 2022, the transportation sector accounted for 86% of the petroleum consumed in Arizona.98 To meet federal air quality standards, the Tucson area requires oxygenated motor gasoline in the winter. More stringent state regulations require the use of an oxygenated blend of motor gasoline called Arizona Clean Burning Gasoline (CBG) in Maricopa County, including the city of Phoenix, where motor vehicles are the single largest source of air pollution.99,100 The state does not produce any fuel ethanol, an oxygenate blended into motor gasoline, and Arizona receives the fuel ethanol supplies it needs from midwestern states.101,102,103 In 2022, the industrial sector accounted for about 9% of the state's petroleum consumption. The commercial sector used about 3%, and the residential sector, where 3 in 100 households use petroleum products, mostly propane, for space heating, consumed less than 1%.104,105
Natural gas
Arizona has no significant natural gas reserves.106 With few producing wells and little new drilling activity, Arizona's annual natural gas gross withdrawals declined from a peak of more than 2.1 billion cubic feet in 1990 to about 198 million cubic feet in 2022.107 Almost all the natural gas consumed in Arizona comes from other states via interstate pipelines that enter Arizona at the New Mexico border. About three-fifths of the natural gas that enters the state continues on to California, and about 5% goes to Mexico. Arizona uses about one-third of the natural gas that it receives.108,109 There is no natural gas underground storage capacity in the state, but the state has potential to develop natural gas storage in salt caverns.110,111 However, an above-ground liquefied natural gas storage facility near Tucson came online in late 2019.112
Almost four-fifths of the natural gas consumed in Arizona is used for electric power generation.
The electric power sector uses the largest share of the natural gas consumed in Arizona. In 2022, it accounted for 78% of the natural gas deliveries to state consumers. Although one in three Arizona households use natural gas as their primary home heating fuel, the residential sector accounted for slightly less than 10% of the state's natural gas consumption. The commercial sector used about 8%, and the industrial sector accounted for 4%. The transportation sector used a small amount as vehicle fuel.113,114 Overall, Arizona's per capita natural gas consumption was less than in all but 11 other states in 2020.115,116
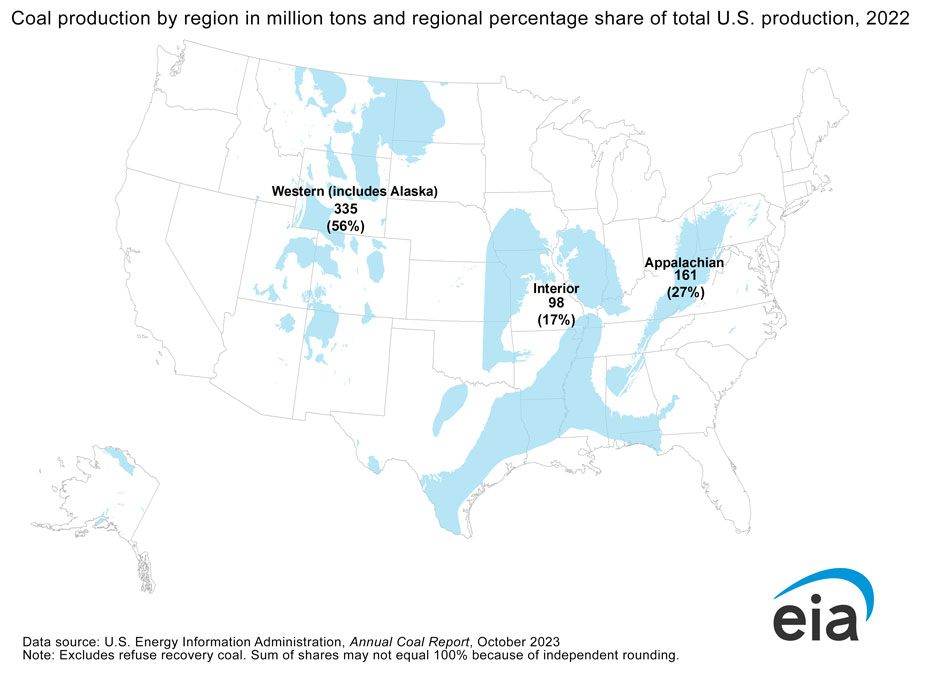
Coal
Arizona has no current coal production. However, areas in the northeastern part of the state on the Navajo and Hopi reservations and in east-central Arizona have some coal.117 The state's last coal mine, the Kayenta mine, ceased operations in 2019 because its only customer, the coal-fired Navajo Generating Station, closed.118 Before its closure, that mine was one of the 30 largest coal mines in the nation, and in 2018 it accounted for almost 1% of the nation's coal production.119 In 2022, the coal that supplied Arizona's remaining four coal-fired power plants came into the state by rail from New Mexico, Wyoming, and Montana. The state's industrial plants received a small amount of coal (about 3% of the state's total deliveries) from Colorado.120,121 In 2023, Arizona consumed 7.5 million tons of coal, less than half the amount of coal the state used in 2018.122
Energy on tribal lands
Arizona is home to 22 federally recognized Native American tribes, and 3 of the nation's 10 largest reservations as measured by land area, including most of the Navajo Nation's, the largest reservation in the United States.123,124,125 Only Oklahoma has more Native American residents than Arizona.126 As tribes and individuals, Native Americans hold more than one-fourth of Arizona's land—the largest share in any state and second only to Alaska in total acreage—and almost all of Arizona's energy mineral resources are on tribal lands.127,128
Almost all of Arizona’s energy mineral resources are on tribal lands.
All of Arizona's commercial coal production was on the Navajo and Hopi reservations. Until its closure in 2019, the state's largest coal-fired power plant was also on tribal land.129 Several natural gas pipelines, electricity transmission lines, hydroelectric dams, and uranium resources are located on Arizona's reservations.130 From 1944 to 1986, more than 500 uranium mines on Navajo Nation land, mostly in Arizona, produced almost 30 million tons of ore. Although most of these mines are abandoned, uranium mining has resumed in December 2023 at the Pinyon Plain Mine, located on tribal lands.131,132 The Navajo Nation opposes the transportation of uranium across tribal lands and has asked the federal government to ban trucks from carrying uranium through tribal lands.133
The largest producing oil field in Arizona—Dineh-bi-Keyah, known as The People's Field—is on the Navajo Nation reservation. The field has produced about 19 million barrels of crude oil since its discovery in 1967 and accounts for almost all of Arizona's crude oil production.134,135 Dineh-bi-Keyah field and other areas on the reservation contain reserves of helium gas, which is widely used in scientific, medical, and industrial equipment.136,137
Many Arizona tribes have significant solar, geothermal, wind, and biomass resources suitable for on-site generation of electricity.138,139 Three of the nation's top five tribes with the greatest electricity generation potential from solar resources—both solar thermal and utility-scale solar PV—are in Arizona, as are two of the five tribes with the greatest potential for geothermal-sourced generation. The Navajo reservation, in large part because of its size, has the largest solar and geothermal energy potential among all U.S. reservations.140 In 2017, the first large-scale solar PV facility on Navajo land came online with 27 megawatts of capacity.141 In 2019, the facility added another 28 megawatts of capacity. In 2023, new solar PV projects added over 645 megawatts of capacity in Arizona.142 In 2024, two solar PV projects on Navajo and Hopi tribal lands were selected as part of the U.S. Department of Energy's funding for community-driven energy projects aimed at lowering energy costs and enhancing energy security in remote communities.143 The U.S. Department of Energy has funded numerous Arizona tribal energy projects during the past decade.144
Endnotes
1 U.S. Department of the Interior, National Park Service, Arizona, accessed May 20, 2024.
2 U.S. Energy Information Administration (EIA), Arizona Profile Data, Reserves, accessed May 20, 2024.
3 U.S. EIA, Annual Coal Report 2022 (October 3, 2023), Table 15, Recoverable Coal Reserves at Producing Mines, Estimated Recoverable Reserves, and Demonstrated Reserve Base by Mining Method, 2022.
4 National Renewable Energy Laboratory, Geospatial Data Science, Solar Resource Maps and Data, accessed May 20, 2024.
5 Roberts, Billy, Geothermal Resource of the United States, National Renewable Energy Laboratory (February 22, 2018).
6 Selover, Nancy, "Arizona-A State of Mild Temperatures as well as Extremes," Arizona's Climate, The CoCoRaHS ‘State Climates' Series, accessed May 20, 2024.
7 Arizona State Climate Office, Climate of Arizona, accessed May 20, 2024.
8 Roberts, Billy J., Direct Normal Solar Irradiance, National Renewable Energy Laboratory (February 22, 2018).
9 U.S. Department of Energy, Energy Efficiency and Renewable Energy, WINDExchange, Wind Energy in Arizona, accessed May 20, 2024.
10 Freeworldmaps.net, Physical Map of Arizona, accessed May 20, 2024.
11 Arizona Department of Forestry and Fire Management, Urban and Community Forestry, accessed May 20, 2024.
12 Western Regional Climate Center, Climate of Arizona, accessed May 20, 2024.
13 U.S. Bureau of Reclamation, Interior Region 7, Upper Colorado Basin, Glen Canyon Unit, accessed May 20, 2024.
14 Arizona State Museum, Culture History of Southern Arizona: Europeans Arrive, accessed May 20, 2024.
15 U.S. Department of the Interior, Bureau of Land Management, Public Land Statistics, 2022 (June 2023), Table 1-3, Mineral and Surface Acres Administered by the Bureau of Land Management, Fiscal Year 2022, p. 7.
16 U.S. Geological Survey, Mineral Commodity Summaries 2023 (January 31, 2023), p. 62.
17 U.S. Geological Survey, The Mineral Industry of Arizona, accessed May 20, 2024.
18 Uranium Producers of America, Uranium in America, Uranium in Arizona, accessed May 20, 2024.
19 Energy Fuels Inc., "In Response to Surging Prices, Supportive Government Policies, and a Domestic Focus on Security of Supply, Energy Fuels Has Commenced Production at Three of its U.S. Uranium Mines," Press Release (December 28, 2023).
20 U.S. Department of Agriculture, Forest Service, Pinyon Plain Mine (formerly Canyon Uranium Mine), accessed May 29, 2024.
21 U.S. Department of Energy, Office of Nuclear Energy, "Russian Uranium Ban Will Speed up Development of U.S. Nuclear Fuel Sully Chain," released May 14, 2024.
22 U.S. Bureau of Economic Analysis, Tools, Interactive Data, Regional Data, GDP and Personal Income, Annual Gross Domestic Product by State, SAGDP2 GDP in current dollars, Arizona, All statistics in table, 2023.
23 Arizona Commerce Authority, Arizona Industries, accessed May 20, 2024.
24 U.S. EIA, State Energy Data System, Table C14, Energy Consumption Estimates per Capita by End-Use Sector, Ranked by State, 2021.
25 U.S. EIA, State Energy Data System, Table C1, Energy Consumption Overview: Estimates by Energy Source and End-Use Sector, 2021.
26 U.S. Census, 2020 Census: Arizona Profile, Population Density by Census Tract.
27 Zhekova, Dobrina, "This Arizona City Was Just Named the Best Place to Retire for Healthcare, Low Crime Rates, and Perfect Weather," Travel+Leisure (April 2, 2024).
28 U.S. Census Bureau, State Population Totals and Components of Change: 2020-2023, Tables, Annual and Cumulative Estimates of Resident Population Change for the United States, Regions, States, District of Columbia, and Puerto Rico and Region and State Rankings: April 1, 2020 to July 1, 2023, XLS.
29 Western Regional Climate Center, Climate of Arizona, Climate and Economy, accessed May 20, 2024.
30 Rice, Valorie, "State of Housing: Arizona House Characteristics from 2020 Census," The University of Arizona's Economic and Business Research Center (September 22, 2023).
31 U.S. Census Bureau, Arizona, Table B25002, Occupancy Status, 2022 American Community Survey 1-Year Estimates, and Table B25004, Vacancy Status, 2022 American Community Survey 1-Year Estimates.
32 U.S. EIA, Electricity Data Browser, Net generation for all sectors, Arizona, Fuel Type (Check all), Annual, 2001-23.
33 U.S. EIA, Arizona Electricity Profile 2022, Tables 2A, 2B.
34 U.S. EIA, "Plant Vogtle Unit 4 begins commercial operation," Today in Energy (May 1, 2024).
35 U.S. EIA, Electricity Data Browser, Net generation for all sectors, Arizona, Fuel Type (Check all), Annual, 2001-23.
36 U.S. EIA, U.S. Nuclear Generation and Generating Capacity, 2023 P XLSX, released May 28, 2024.
37 U.S. EIA, Arizona Electricity Profile 2018, Tables 2A, 2B.
38 U.S. EIA, Electricity Data Browser, Plant lever data, List of plants for coal, Arizona, all sectors, 2015-23.
39 U.S. EIA, Electricity, Preliminary Monthly Electric Generator Inventory (based on Form EIA-860M as a supplement to Form EIA-860), Inventory of Retired Generators as of April 2024.
40 U.S. EIA, Electricity Data Browser, Net generation for all sectors, Arizona, Fuel Type (Check all), Annual, 2001-23.
41 Central Arizona Project, accessed May 22, 2024.
42 Maricopa Association of Governments, Arizona Demographics, accessed May 20, 2024.
43 U.S. EIA, Arizona Electricity Profile 2022, Table 10, Supply and disposition of electricity, 1990 through 2022.
44 U.S. Department of Energy, Biden-Harris Administration Announces $1.3 Billion to Build Out Nation's Electric Transmission and Releases New Study Identifying Critical Grid Needs, released October 30, 2023.
45 U.S. Department of the Interior, Bureau of Land Management, Proposed SunZia Southwest Transmission Project, accessed April 5, 2023.
46 Western Electricity Coordinating Council, SunZia Southwest Transmission Projects - Annual Progress Report: 2024, issued February 20, 2024.
47 TransWest Express, Project purpose, accessed May 22, 2024.
48 Ten West Link, About the project, accessed May 22, 2024.
49 U.S. EIA, Electricity, Preliminary Monthly Electric Generator Inventory (based on Form EIA-860M as a supplement to Form EIA-860), Inventory of Operating Generators and Planned Generators, Technology: Batteries, as of April 2024.
50 Bowen, Thomas and Ilya Chernyakhovsky, Grid-Scale Battery Storage, National Renewable Energy Laboratory (September 2019).
51 U.S. Geological Survey, Lithium Deposits in the United Stated, released June 1, 2020.
52 Arizona Lithium, Big Sandy Lithium, accessed May 23, 2024.
53 U.S. EIA, State Energy Data System, Table C17, Electricity Retail Sales per Capita, Ranked by State, 2021.
54 U.S. Census Bureau, Arizona, Occupied Housing Units, Table B25040, House Heating Fuel, 2022 American Community Survey 1-Year Estimates.
55 U.S. EIA, Residential Energy Consumption Survey, 2020, State Data, Highlights for air conditioning in U.S. homes by state, 2020.
56 U.S. EIA, Electricity Data Browser, Retail sales of electricity, Arizona, All sectors, Annual, 2023.
57 U.S. EIA, Monthly Energy Review (May 2024), Appendix F, monthly state file, XLS.
58 U.S. EIA, Electricity Data Browser, Net generation for all sectors, Arizona, Fuel Type (Check all), Annual, 2001-23.
59 U.S. EIA, Electric Power Monthly (March 2024), Table 6.2.B.
60 U.S. EIA, Electric Power Monthly (February 2024), Tables 1.17.B, 1.18.B.
61 U.S. EIA, Electric Power Monthly (March 2024), Table 1.18.B.
62 U.S. EIA, Solar Explained, Solar Thermal Power Plants, accessed May 23, 2024.
63 U.S. EIA, Electricity, Preliminary Monthly Electric Generator Inventory (based on Form EIA-860M as a supplement to Form EIA-860), Inventory of Operating Generators as of April 2024.
64 U.S. EIA, Electricity Data Browser, Net generation for all sectors, Arizona, Fuel Type (Check all) , Annual, 2001-23.
65 Arizona State Climate Office, Drought, accessed May 19, 2024.
66 U.S. EIA, "Western U.S. hydropower generation fell to a 22-year low last year," Today in Energy (March 26, 2024).
67 U.S. EIA, Arizona Electricity Profile 2022, Table 2A.
68 U.S. Bureau of Reclamation, Upper Colorado Region, Glen Canyon Unit, updated May 19, 2023.
69 U.S. EIA, Electricity Data Browser, List of plants for conventional hydroelectric, Arizona, all sectors 2023.
70 U.S. EIA, Electric Power Monthly (February 2024), Table 6.2.A.
71 U.S. EIA, Energy Explained, Hydropower explained, updated April 20, 2023.
72 U.S. EIA, Electricity Data Browser, List of plants for hydro-electric pumped storage, Arizona, all sectors, 2023.
73 U.S. EIA, Electric Power Monthly (February 2024), Table 6.2.A.
74 U.S. EIA, Electricity Data Browser, Net generation for all sectors, Arizona, Fuel Type (Check all), Annual, 2001-23.
75 U.S. EIA, Electricity Data Browser, List of plants for wind, Arizona, all sectors 2023.
76 U.S. Department of Energy, Energy Efficiency and Renewable Energy, WINDExchange, U.S. Installed and Potential Wind Power Capacity and Generation, Potential, U.S Potential Wind Capacity in Megawatts (MW) at 80 Meters, accessed May 28, 2024.
77 U.S. EIA, Electricity, Preliminary Monthly Electric Generator Inventory (based on Form EIA-860M as a supplement to Form EIA-860), Inventory of Operating Generators as of April 2024.
78 NextEra Energy Resources LLC, Project Overview, accessed May 21, 2024.
79 AES, Chevelon Butte Wind Farm, accessed May 21, 2024.
80 U.S. EIA, Electricity Data Browser, Net generation for all sectors, Arizona, Fuel Type (Check all) , Annual, 2001-23.
81 U.S. EIA, Electricity, Preliminary Monthly Electric Generator Inventory (based on Form EIA-860M as a supplement to Form EIA-860), Inventory of Operating Generators as of April 2024.
82 U.S. EIA, Monthly Densified Biomass Fuel Report, Table 1, Densified biomass fuel manufacturing facilities in the United States by state, region, and capacity, January 2024.
83 U.S. Census Bureau, Arizona, Occupied Housing Units, Table B25040, House Heating Fuel, 2022 American Community Survey 1-Year Estimates.
84 Arizona Geological Survey, Geothermal in Arizona, Geothermal Sources, accessed May 24, 2024.
85 U.S. EIA, Electricity Data Browser, Net generation for all sectors, Arizona, All fuels Geothermal, Annual, 2001-23.
86 U.S. Department of Energy, Energy Efficiency and Renewable Energy, Geothermal Technologies Program, Arizona (April 2006).
87 Cariaga, Carlo, "Copper extraction project in Arizona aims to harness geothermal heating," ThinkGeoEnergy (May 7, 2024).
88 Arizona Corporation Commission, Renewable Energy Standard and Tariff, accessed May 24, 2024.
89 "Arizona regulators vote to repeal state renewable energy target, efficiency rules," S&P Global (February 8, 2024).
90 U.S. EIA, U.S. Crude Oil and Natural Gas Proved Reserves, Year-end 2022 (August 29, 2024), Table 6. Crude oil and least condensate proved reserves, reserves changes, by states, and areas, 2022.
91 U.S. EIA, Crude Oil Production, Annual, Thousand Barrels, 2023.
92 Towne, Douglas, "Arizona's Ill-Fated Oil Boom," Phoenix (September 6, 2022).
93 Arizona Department of Environmental Quality, Helium Gas Extraction in Arizona - Protecting Arizona's Water Quality, accessed May 24, 2024.
94 Desert Mountain Energy, Arizona's Holbrook Basin is known for some of the world's highest grade helium, accessed May 24, 2024.
95 U.S. Department of Energy, Fossil Energy, Office of Oil & Natural Gas, Arizona Natural Gas Flaring and Venting Regulations, accessed May 24, 2024.
96 U.S. EIA, Arizona Number of Operable Refineries as of January 1, 1980-2023.
97 Kinder Morgan, Products Pipelines, Refined Products Pipelines, Pacific Operations, SFPP, accessed May 24, 2024.
98 U.S. EIA, State Energy Data System, Table F16, Total Petroleum Consumption Estimates, 2022.
99 Larson, B. K., U.S. Gasoline Requirements as of January 2018, ExxonMobil, accessed May 24, 2024.
100U.S. Environmental Protection Agency, Gasoline Standards, Reformulated Gasoline, accessed May 24, 2024.
101 U.S. EIA, U.S. Fuel Ethanol Plant Production Capacity, XLSX file, U.S. Nameplate Fuel Ethanol Production Capacity, January 2023.
102 U.S. EIA, State Energy Data System, Table F25, Fuel ethanol consumption estimates, 2022.
103 U.S. EIA, Movements by Pipeline, Tanker, Barge and Rail between PAD Districts, Fuel Ethanol, Annual, 2017-23.
104 U.S. EIA, State Energy Data System, Table F16, Total Petroleum Consumption Estimates, 2022.
105 U.S. Census Bureau, Arizona, Occupied Housing Units, Table B25040, House Heating Fuel, 2022 American Community Survey 1-Year Estimates.
106 U.S. EIA, Arizona Profile Data, Reserves, accessed May 24, 2024.
107 U.S. EIA, Arizona Natural Gas Gross Withdrawals, 1971-2022.
108 U.S. EIA, International and Interstate Movements of Natural Gas by State, Arizona, 2016-22.
109 U.S. EIA, Natural Gas Consumption by End Use, Arizona, 2018-23.
110 U.S. EIA, Underground Natural Gas Storage Capacity, Total Storage Capacity, 2016-22.
111 Rauzi, S.L., "Salt Deposits in Arizona promise gas-storage opportunities," Oil & Gas Journal (April 29, 2002).
112 Southwest Gas, Southern Arizona LNG Reliability Project, accessed May 24, 2024.
113 U.S. Census Bureau, Arizona, Occupied Housing Units, Table B25040, House Heating Fuel, 2022 American Community Survey 1-Year Estimates.
114 U.S. EIA, Natural Gas Consumption by End Use, Arizona, 2017-22.
115 U.S. EIA, State Energy Data System, Table F18, Natural Gas Consumption Estimates, 2021.
116 U.S. Census Bureau, State Population Totals and Components of Change: 2020-2023, Annual Estimates of the Resident Population for the United States, Regions, States, District of Columbia, and Puerto Rico: April 1, 2020 to July 1, 2023.
117 Kirschbaum, Mark A., and Laura R. H. Biewick, Chapter B, A Summary of the Coal Deposits in the Colorado Plateau: Arizona, Colorado, New Mexico and Utah, U.S. Geological Survey Professional Paper 1625-B, U.S. Department of the Interior, U.S. Geological Survey (2000), p. B3-B7.
118 Randazzo, Ryan, and Shondiin Silversmith, "Largest coal plant in the West shuts down, dealing financial losses to Native American tribes," USA Today (November 18, 2019).
119 U.S. EIA, Annual Coal Report 2018 (October 2019), Tables 1, 9, 14.
120 U.S. EIA, Electricity, Preliminary Monthly Electric Generator Inventory (based on Form EIA-860M as a supplement to Form EIA-860), Inventory of Operating Generators as of April 2024.
121 U.S. EIA, Annual Coal Distribution Report 2022 (October 3, 2023), By Coal Destination State, Arizona Table DS-3, Domestic Coal Distribution, by Destination State, 2022.
122 U.S. EIA, Coal Data Browser, Total Consumption, Arizona, 2018-22.
123 Arizona State Museum, Federally Recognized Native Nations in Arizona, accessed May 28, 2024.
124 U.S. Department of the Interior, Bureau of Indian Affairs, "Indian Entities Recognized and Eligible to Receive Services from the United States Bureau of Indian Affairs," Federal Register, Vol. 88, No. 8, Thursday, January 12, 2023, Notices, p. 2112-2116.
125 Pariona, Amber, "Biggest Indian Reservations in The United States," World Atlas, accessed May 28, 2024.
126 U.S. Census Bureau, "A Look at the Largest American Indian and Alaska Native Tribes and Villages in the Nation, Tribal Areas and States," (October 3, 2023).
127 Mariella, Pat, Teresita Clashin, and Shawn Williams, "Chapter 7, Tribes and Energy within Arizona," Arizona's Energy Future, Arizona State University (November 6-9, 2011), p. 91.
128 U.S. Forest Service, Forest Service National Resource Guide to American Indian and Alaska Native Relations, Appendix D: Indian Nations, The American Indian Digest (April 1997), Table D.2, State with the Greatest Acreages of Indian Land.
129 Randazzo, Ryan, and Shondiin Silversmith, "Largest coal plant in the West shuts down, dealing financial losses to Native American tribes," USA Today (November 18, 2019).
130 Mariella, Pat, Teresita Clashin, and Shawn Williams, "Chapter 7, Tribes and Energy within Arizona," Arizona's Energy Future, Arizona State University (November 6-9, 2011), p. 92, 93, 97, 98.
131 U.S. Environmental Protection Agency, Navajo Nation: Cleaning Up Abandoned Uranium Mines, updated April 19, 2024.
132 Energy Fuels Inc., "In Response to Surging Prices, Supportive Government Policies, and a Domestic Focus on Security of Supply, Energy Fuels Has Commenced Production at Three of its U.S. Uranium Mines," Press Release (December 28, 2023).
133 Podmore, Amanda, "Navajo Nation Asks Biden to Stop Uranium Transport from Grand Canyon Mine," Grand Canyon Trust (May 15, 2024).
134 U.S. EIA, Arizona Field Production of Crude Oil, Annual, 1981-2023.
135 Ascarza, William, "Mine Tales: Though not exactly Texas, Arizona does have oil," updated July 15, 2019.
136 Desert Mountain Energy, Arizona's Holbrook Basin is known for some of the world's highest grade helium, accessed May 24, 2024.
137 Arizona Department of Environmental Quality, Helium Gas Extraction in Arizona - Protecting Arizona's Water Quality, accessed May 24, 2024.
138 Mariella, Pat, Teresita Clashin, and Shawn Williams, "Chapter 7, Tribes and Energy within Arizona," Arizona's Energy Future, Arizona State University (November 6-9, 2011), p. 95-98.
139 National Renewable Energy Laboratory, Tribal Energy Atlas, accessed May 28, 2024.
140 U.S. Department of Energy, Office of Indian Energy, Developing Clean Energy Projects on Tribal Lands, Data and Resources for Tribes, DOE/IE-0015 (April 2013), p. 40, 44, 52
141 U.S. Department of Transportation, Federal Highway Administration, Center for Innovative Finance Support, Project Profile: Navajo Nation Kayenta Solar Program (Phase I & II), Arizona, accessed May 28, 2024.
142 U.S. EIA, Electricity, Preliminary Monthly Electric Generator Inventory (based on Form EIA-860M as a supplement to Form EIA-860), Inventory of Operating Generators as of April 2024.
143 U.S. Department of Energy, "Biden-Harris Administration Announces $366 Million to Lower Energy Costs and Enhance Energy Security in Rural and Remote Communities Across the Nation," Press Release (February 27, 2024).
144 U.S. Department of Energy, Office of Indian Energy Policy and Programs, Tribal Energy Projects Database, Arizona, accessed May 28, 2024.
Other Resources
Energy-Related Regions and Organizations
- Coal Region: Western
- Petroleum Administration for Defense District (PADD): 5
- North American Electric Reliability Corporation (NERC) ERO Enterprise: Regional Entities: Western Electricity Coordinating Council (WECC)
Other Websites
- Arizona Geological Survey, Energy Resources of Arizona
- Arizona Department of Economic Security, Low Income Home Energy Assistance Program
- Arizona Corporation Commission - Utilities Division
- Arizona Oil and Gas Conservation Commission
- Arizona Department of Housing, Weatherization Assistance Program
- Arizona Commerce Authority, Renewable Energy
- Arizona Geological Survey, Mining in Arizona
- U.S. Nuclear Regulatory Commission, Arizona
- EIA Arizona Flickr Album
- Western Regional Partnership (WRP)
- Alternative Fuels Data Center, Federal and State Laws and Incentives
- Western Area Power Administration (WAPA)
- Bureau of Land Management, Renewable Energy
- Usa.Gov, Get help with energy bills
- NC Clean Energy Technology Center, Database of State Incentives for Renewables and Efficiency (DSIRE)
- National Association of Regulatory Utility Commissioners (NARUC)
- National Association of State Energy Officials (NASEO)
- National Conference of State Legislatures (NCSL), Energy
- National Renewable Energy Laboratory (NREL), Geospatial Data Science Data and Tools
- U.S. Geological Survey (USGS), Publications
- Interstate Oil and Gas Compact Commission (IOGCC)
- Western Interstate Energy Board (WEIB)
- U.S. Department of Health & Human Services, Office of Community Services, An Office of the Administration for Children & Families, Low Income Home Energy Assistance Program (LIHEAP)
- U.S. Geological Survey, Maps
- Lawrence Livermore National Laboratory, Energy Flow Charts
- National Renewable Energy Laboratory, State and Local Planning for Energy (SLOPE)
- U.S. Department of Energy, Office of Indian Energy Policy and Programs
- National Renewable Energy Laboratory, Tribal Energy Atlas
- EIA Status of U.S. Nuclear Outages
- EIA Natural Gas Storage Dashboard
- EIA Energy Disruptions
- U.S. Department of Agriculture (USDA), Rural Development, Energy Programs