Released: August 1, 2012
Next Release: August 8, 2012
Refineries Continue to Run at High Levels in the Central United States
While the well-publicized growth in U.S. tight oil production has the potential to significantly alter long-standing relationships in international crude oil markets, domestic price divergences resulting from this growth have already had a major impact on the U.S. refining sector. Monthly data for May from the U.S. Energy Information Administration (EIA) confirm two trends: U.S. refineries continue to run at high levels, and disparities in the regional economics of the U.S. refining market persist. U.S. refineries have run 330,000 barrels per day (bbl/d) (2.3 percent) more crude oil year-to-date through May in 2012 compared to 2011 (Figure 1). This increase in crude runs has been concentrated in the Midwest, Gulf Coast, and Rocky Mountain regions, areas which have access to discounted land-locked crude oils or which have refineries with substantial upgrading capacity.
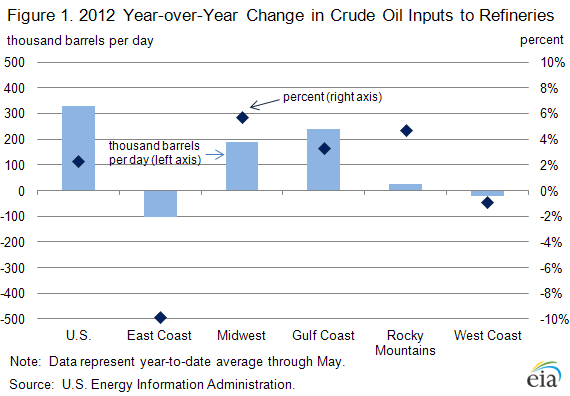
In 2012, the U.S. refining sector has generally been refining more barrels of crude oil than at any point since the large drop in petroleum prices in 2008. In May, U.S. refineries as a whole ran 15.2 million bbl/d of crude oil, a 3-percent increase compared to a year earlier. With the addition of the May data, 2012 year-to-date crude runs at U.S. refineries have averaged about 14.7 million bbl/d, the highest runs during the first five months of the year since 2008, and 220,000 bbl/d (1.5 percent) higher than the five-year average. Looking only at the national level of U.S. refinery runs, however, reveals just part of the picture. There are significant regional disparities in the underlying economics leading refinery runs to vary greatly among regions.
Refineries in the Midwest and Rocky Mountains are running at record-high levels to take advantage of lower-cost feedstocks available as a result of surging tight-oil production in those areas, along with some capacity expansions which have allowed for the processing of more heavy, sour Canadian crude. In 2012, the refiner acquisition cost of crude oil (RAC) for the Midwest and the Rocky Mountains has averaged $11 per barrel and $15 per barrel, respectively, below the U.S. average RAC. This price advantage has resulted in increased margins for refiners with access to the discounted crude oil, encouraging persistently high crude oil runs and refinery capacity utilization. Midwest refineries have run an average of just under 3.5 million bbl/d of crude oil through May in 2012, a 5.7-percent increase over 2011 and an 8.6-percent increase over the average from 2007 through 2011. In April, Midwest runs were the highest of any month since July 2000. Runs have been particularly high in Kansas and Oklahoma, where refineries are closely linked to the Cushing trading hub for West Texas Intermediate crude oil, which has been discounted for much of the past two years compared to global benchmarks such as Brent. Although they have a much smaller total capacity, refineries in the Rocky Mountains have run 559,000 bbl/d of crude oil in 2012, a 4.7-percent increase from 2011.
Gulf Coast refineries are also running at higher levels than they have been in recent years. Although crude oil input costs are not as low for Gulf Coast refiners as they are for those in the Midwest and Rocky Mountains, the Gulf Coast refining complex has added capacity in recent years leading to increased crude oil runs. The Gulf Coast produces more refined products than required to satisfy regional demand, and refineries in the region tend to have deep-conversion capacity. This abundance of relatively sophisticated capacity allows refiners to produce a high-value product slate which, given the Gulf's location, can be efficiently exported to serve other regions of the United States, as well as growing Latin American markets.
The East and West Coasts are the exception to the trend of higher refinery runs. Those regions' reliance on relatively expensive crude oil, along with reductions in capacity over the last several years, has led to below-average runs. West Coast crude runs are down 0.9 percent in 2012 compared to last year, and have been 5.7 percent below their five-year average. On the East Coast, runs are down 9.9 percent year-over-year through May. This decline can be largely attributed to the East Coast having less operable capacity this year than last. In addition, East Coast crude oil costs have been about $12 per barrel above the U.S. average in 2012. These high crude oil costs were part of the reason behind the 2011 announcement of the potential closure of three of the regions' refineries in 2012. However, recent developments indicate that only one of these three refineries - Sunoco's Marcus Hook plant - will be closed permanently. The former ConocoPhillips Trainer facility, now owned by Delta Air Lines, was closed in September 2011 and is expected to return to service later this year. Sunoco's Philadelphia refinery is expected to remain in operation following the formation of a joint venture between The Carlyle Group and Sunoco. Once Trainer restarts, crude runs on the East Coast will likely increase.
The impacts of these changes in crude runs are becoming apparent. Increased gasoline and distillate production in the Midwest, a traditional market for Gulf Coast products, has reduced the requirement to ship products up from the Gulf. As a result, more products produced in the Gulf are available for export or delivery to the East Coast. See the July 5 edition of TWIP for additional discussion of distillate exports.
Gasoline and diesel fuel prices both increase for the 4th consecutive week
The U.S. average retail price of regular gasoline increased a penny this week to $3.51 per gallon, 20 cents per gallon lower than last year at this time. Prices decreased by one cent on the West Coast and three cents in the Rocky Mountain region to $3.71 per gallon and $3.47 per gallon, respectively, but increased in all other regions. The Midwest saw the largest increase, with the price up three cents to $3.52 per gallon. The Gulf Coast price is $3.31 per gallon, up 2 cents from last week, and the average price on the East Coast is up a penny to $3.50 per gallon.
The national average diesel fuel price increased a penny to $3.80 per gallon, 14 cents per gallon lower than last year at this time. Prices decreased on the Gulf and West Coasts and increased in all other regions. The Gulf Coast price is down two cents to $3.70 per gallon to become the lowest in the Nation, while the West Coast price decreased less than a penny to remain at $3.90 per gallon. The Midwest and Rocky Mountain prices both increased three cents to $3.78 per gallon and $3.73 per gallon, respectively. Rounding out the regions, the East Coast price is $3.84 per gallon, up two cents from last week.
Propane inventories show another rise
Total U.S. inventories of propane grew by 1.4 million barrels last week to end at 67.5 million barrels, 18 million barrels (37 percent) higher than a year ago. The majority of new stocks went to the Gulf Coast region, which grew by 1.1 million barrels. Meanwhile, the East Coast and Midwest regions were up 0.2 and 0.1 million barrels respectively, while Rocky Mountain/West Coast stocks drew slightly. Propylene non-fuel-use inventories represented 7.3 percent of total propane inventories.
Text from the previous editions of This Week In Petroleum is accessible through a link at the top right-hand corner of this page.
 |
 |
||||||
| Retail Data | Change From Last | Retail Data | Change From Last | ||||
| 07/30/12 | Week | Year | 07/30/12 | Week | Year | ||
| Gasoline | 3.508 | Diesel Fuel | 3.796 | ||||
 |
 |
||||||||||||||||||||||||||
|
 |
||||||||||||||||||||||||||
| *Note: Crude Oil Price in Dollars per Barrel. | |||||||||||||||||||||||||||
 |
 |
||||||
 |
 |
||||||
| Stocks Data | Change From Last | Stocks Data | Change From Last | ||||
| 07/27/12 | Week | Year | 07/27/12 | Week | Year | ||
| Crude Oil | 373.6 | Distillate | 124.3 | ||||
| Gasoline | 207.9 | Propane | 67.463 | ||||