April sets monthly record for net distillate exports
One of the main drivers behind the United States' transformation from a net petroleum product importer to a net petroleum product exporter over the last several years has been the increase in distillate exports. U.S. Energy Information Administration (EIA) monthly data indicate the increase in net exports of distillates has continued largely unabated in 2012, with net exports of distillate fuels in April registering 981,000 barrels per day (bbl/d) (Figure 1), the highest volume since monthly U.S. trade data have been recorded. The distillate trade balance for April reflects both a near-record level of exports and a sluggish flow of imports.
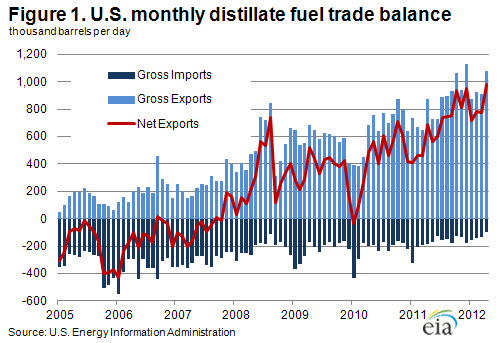
In the first four months of this year, gross distillate exports have averaged 947,000 bbl/d, a 215,000-bbl/d (29-percent) increase compared with the same period in 2011. This average was supported by an April number that was the strongest to date in 2012 at slightly less than 1.1 million bbl/d, a 206,000-bbl/d (24-percent) increase over April 2011. The April exports also represent the second highest monthly total ever.
Sustained high levels of gross distillate exports have been supported by growth in global demand for distillate fuels, especially in the developing economies not part of the Organization for Economic Cooperation and Development (non-OECD). According to International Energy Agency (IEA) data, non-OECD demand for gas/diesel oil (a product category similar to EIA's distillate fuels) grew 403,000 bbl/d (3 percent) from April 2011 to April 2012. Due to global demand growth, distillate margins for refiners have generally been strong in recent years compared to those for other fuels. This has encouraged the production of distillate at U.S. refineries.
The largest destination for U.S. distillate exports is the Central and South America region and Mexico, a market where demand for distillate fuels has been robust, outstripping the ability of refineries in the region to satisfy this demand. In the first four months of this year, 60 percent of U.S. distillate exports went to Central and South America or Mexico, up from 57 percent for the same period last year. Growth in exports to those markets alone accounted for all of the year-over-year increase in exports for April, with exports to Central and South America up 223,000 bbl/d (58 percent) and exports to Mexico up 44,000 bbl/d (55 percent). This was partially offset by a weak month for distillate exports to Western Europe, another important market for U.S. distillate fuels. Exports to Western Europe were 62,000 bbl/d (19 percent) lower than April 2011. However, exports to Western Europe for all of 2012 are still up year-over-year, as reduced European refining capacity has worked to offset weak demand on the continent.
At the same time exports have been buoyed by global demand, lower distillate consumption in the United States has reduced the need to import. Through April, U.S. distillate consumption in 2012 was 112,000 bbl/d (3 percent) lower than the same period in 2011, in part reflecting reduced consumption of heating oil due to the mild winter weather. Combined with higher distillate production, this led to significantly reduced levels of imports, which through April were down 42 percent year-over-year. In April 2012, the United States imported 98,000 bbl/d of distillate fuel, which was the lowest monthly total since August 1985. Most U.S. distillate imports are shipped from Canada (82 percent in 2012 to date) to the East Coast (PADD 1), and are the result of opportunistic trade with refineries in Canada's maritime provinces which are closely integrated into the U.S. East Coast market. While the East Coast does also export some distillate fuel, the vast majority of U.S. distillate exports originate from the Gulf Coast, where refinery production far outpaces demand and distance to Latin America is short. The Gulf Coast also ships large quantities of diesel via pipeline to other U.S. markets.
Gasoline and diesel fuel prices continue to drop
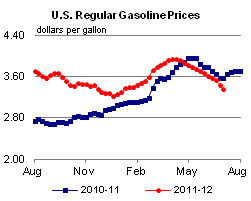
The U.S. average retail price of regular gasoline decreased eight cents this week to $3.36 per gallon, 22 cents per gallon lower than last year at this time. This is the 13th consecutive week that the average U.S. price has declined. Prices dropped in all regions of the Nation, with the largest decrease in both the Midwest and West Coast, where the average price fell almost 11 cents, to $3.32 per gallon and $3.72 per gallon, respectively. The Gulf Coast price dropped seven cents to $3.13 per gallon, while the price on the East Coast and in the Rocky Mountains both fell a nickel to $3.29 per gallon and $3.58 per gallon, respectively.
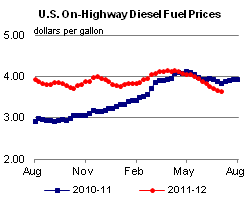
The national average diesel fuel price decreased three cents to $3.65 per gallon, 20 cents per gallon lower than last year at this time. This marks the 12th consecutive week that the average U.S. price has fallen. The Rocky Mountain region saw the largest decrease, dropping seven cents to $3.71 per gallon. The West Coast price was down a nickel to $3.79 per gallon. The East Coast price fell almost two cents to $3.70 per gallon, while in the Midwest the average diesel price is now $3.58 per gallon, down about three cents from last week. Rounding out the regions, the Gulf Coast price fell three cents to $3.57 per gallon.
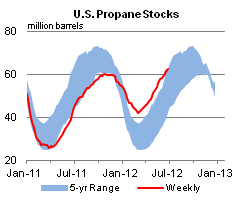
Propane inventories continue to climb
Total inventories of propane grew across all regions of the United States last week, adding 0.9 million barrels to end at 62.2 million barrels in total, 20.7 million barrels (50 percent) higher than a year ago. The Midwest regional stocks rose 0.3 million barrels, the East Coast and Gulf Coast regions each added 0.2 million barrels, and the Rocky Mountain/West Coast inventories were up 0.1 million barrels. Propylene non-fuel-use inventories represented 6.7 percent of total propane inventories.
Text from the previous editions of This Week In Petroleum is accessible through a link at the top right-hand corner of this page.
 |
 |
||||||
| Retail Data | Change From Last | Retail Data | Change From Last | ||||
| 07/02/12 | Week | Year | 07/02/12 | Week | Year | ||
| Gasoline | 3.356 | Diesel Fuel | 3.648 | ||||
 |
 |
||||||||||||||||||||||||||
|
 |
||||||||||||||||||||||||||
| *Note: Crude Oil Price in Dollars per Barrel. | |||||||||||||||||||||||||||
 |
 |
||||||
 |
 |
||||||
| Stocks Data | Change From Last | Stocks Data | Change From Last | ||||
| 06/29/12 | Week | Year | 06/29/12 | Week | Year | ||
| Crude Oil | 382.9 | Distillate | 117.8 | ||||
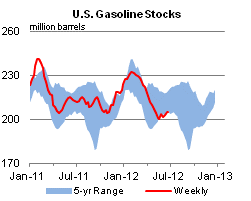
| Gasoline | 205.0 | Propane | 62.233 | ||||