Released: March 14, 2012
Next Release: March 21, 2012
EIA tracks U.S. tight oil production as volumes soar
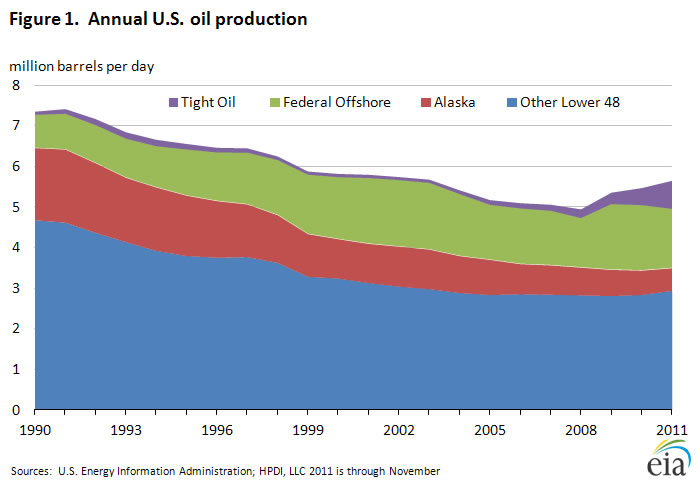
Following decades of decline, U.S. oil production has risen in each of the last three years. While the 2009 increase was driven largely by the growth in deepwater Gulf of Mexico, subsequent increases in domestic crude oil production are primarily the result of the development of tight oil resources (Figure 1). Significant and rapid production increases in tight oil, which comprises oil produced from shale and other very-low-permeability rocks, have been facilitated by the combination of horizontal drilling and hydraulic fracturing, the same technologies used to expand natural gas production in several of the Nation's shale formations. This edition of This Week In Petroleum examines tight oil production by source to illustrate the growing volumetric contribution of tight oil formations.
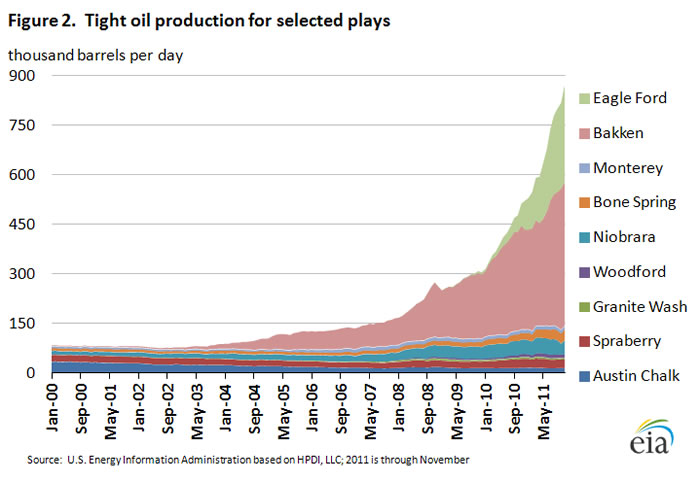
Production from the Nation's tight oil plays more than tripled over the past three years, increasing from about 250 thousand barrels per day (bbl/d) in the beginning of 2009 to nearly 900 thousand bbl/d by November 2011 (Figure 2). Two particularly important tight oil plays, the Bakken formation in North Dakota and Montana, and the Eagle Ford shale in south Texas, accounted for 84 percent of total tight oil production in November 2011 (the most recent month for which full production data are available). While oil production from the Bakken formation is currently about 1.5 times larger than that from the Eagle Ford, recent Eagle Ford production increases have been especially sharp - more than 200 percent during 2011. Bakken volumes rose about 45 percent over the same period.
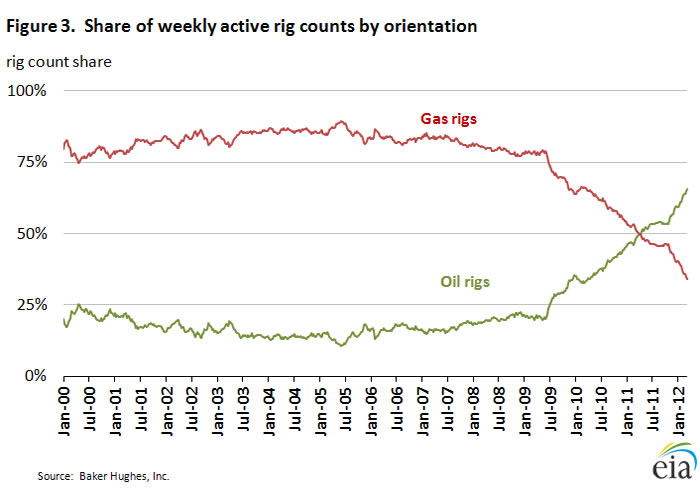
The heightened focus on oil development in shale and other tight formations is evident in the deployment of active drilling rigs. Throughout the 2000s, natural gas rigs generally accounted for about 80 percent or more of the weekly active rig count. The distribution of natural gas- and oil-directed rigs began an appreciable shift in the second half of 2009, and presently the Baker Hughes rig count shows that oil-directed rigs account for nearly two-thirds of active units (Figure 3).
Production from tight oil plays is expected to continue climbing. High oil prices make tight oil development profitable in spite of the higher costs associated with the advanced production methods being used. With lingering low natural gas prices, operators are likely to continue shifting their drilling focus toward "oily" areas, including shale and other tight oil formations (such as the Bakken), as well as liquids-rich areas of shale gas plays (such as the Eagle Ford). A steadily increasing crude oil-to-natural gas ratio underpins the repositioning of exploration and production programs.
Expanding development activity in tight oil formations has also generated some increases in the production of natural gas. In the Bakken formation, for example, natural gas production has nearly tripled since the beginning of 2009. Much of this increase is from associated natural gas produced in conjunction with oil-directed drilling programs. In other areas, natural gas production has increased as operators expand drilling activity in the liquids-rich portions of shale formations.
Significant increases in tight oil production are also expected from emerging plays such as the Niobrara in Colorado, the Utica Shale in Ohio, the Bone Spring in east Texas, and the Monterey in California. Oil production from the Niobrara formation, for example, increased from about 15 thousand bbl/d in early 2007 to over 40 thousand bbl/d by the end of 2011. The rapid and significant increases in the number of drilling permits issued since the beginning of 2011 in Colorado and Ohio reflect the growing interest in tight oil and gas plays in those states.
Gasoline and diesel fuel prices up for the seventh week in a row
The U.S. average retail price of regular gasoline increased 3.6 cents this week to reach $3.83 per gallon, 26 cents per gallon higher than last year at this time. The Rocky Mountain region led the way for a second week, with retail prices in the region jumping almost 15 cents to $3.48 per gallon. The Rocky Mountain price has increased about 28 cents over the last two weeks, but remains the lowest regional average in the Nation. The smallest change came on the East Coast, where the price increased less than a penny to stay at $3.77 per gallon. The West Coast price increased about two cents to reach $4.22 per gallon. On the Gulf Coast the average price is now $3.65 per gallon, and the Midwest price is now two cents below the national average at $3.81 per gallon.
The national average diesel fuel price rose about three cents to $4.12 per gallon, 22 cents per gallon higher than last year at this time. Diesel prices were up across all regions, with the biggest increase coming in the Rocky Mountains for the second week, with prices about eight cents higher than last week's average. The East Coast price increased less than a penny to remain at $4.17 per gallon. On the Gulf Coast, the average price is $4.04 per gallon, and on the West Coast diesel increased about five cents to reach $4.42 per gallon, the highest regional average price in the United States. The Midwest has the lowest average diesel price in the Nation at $4.02 per gallon.
U.S. average wholesale heating fuel prices increase, while residential prices show little change
The U.S. average residential heating oil price increased by less than 1 cent per gallon during the week ending March 12, 2012, to nearly $4.11 per gallon. This price is almost 23 cents per gallon higher than the same time last year. The average wholesale heating oil price increased by 5 cents per gallon over the same period to a price just below $3.37 per gallon, 22 cents higher than last year at this time.
The average residential propane price increased by less than 1 cent during the week ending March 12, 2012 to remain at $2.87 per gallon. This is an increase of 1 cent per gallon when compared with last year's price. The average wholesale propane price increased by 9 cents per gallon to $1.32 per gallon, 8 cents below the March 14, 2011 price of over $1.40 per gallon.
The last data collection for the 2011-2012 SHOPP season will be published next week on Wednesday, March 21, 2012.
Propane stocks continue to drop
Last week, total U.S. inventories of propane declined 1.3 million barrels to end at 42.2 million barrels, 54 percent higher than a year ago. Most of the decline occurred in the Midwest region, which drew 0.9 million barrels. The Gulf Coast drew 0.3 million barrels, the East Coast dropped by 0.1 million barrels and the Rocky Mountain/West Coast regional inventories were down slightly. Propylene non-fuel-use inventories represented 10.3 percent of total propane inventories.
Text from the previous editions of This Week In Petroleum is accessible through a link at the top right-hand corner of this page.
 |
 |
||||||
 |
 |
||||||
| Retail Data | Changes From | Retail Data | Changes From | ||||
| 03/12/12 | Week | Year | 03/12/12 | Week | Year | ||
| Gasoline | 3.829 | Heating Oil | 4.105 | ||||
| Diesel Fuel | 4.123 | Propane | 2.868 | ||||
 |
 |
||||||||||||||||||||||||||
|
 |
||||||||||||||||||||||||||
| *Note: Crude Oil Price in Dollars per Barrel. | |||||||||||||||||||||||||||
 |
 |
||||||
 |
 |
||||||
| Stocks Data | Changes From | Stocks Data | Changes From | ||||
| 03/09/12 | Week | Year | 03/09/12 | Week | Year | ||
| Crude Oil | 347.5 | Distillate | 134.8 | ||||
| Gasoline | 228.1 | Propane | 42.187 | ||||