Idaho Quick Facts
- In 2023, renewable energy sources accounted for 68% of the total electricity generated in Idaho, the fifth-highest share of renewable electricity for any state after Vermont, South Dakota, Washington, and Maine.
- Idaho has the third-lowest average electricity price among the states, in part because of the large amount of the state's generation that comes from relatively inexpensive hydropower, which accounted for 43% of the state's generation in 2023.
- Idaho ranks among the 10 states with the lowest petroleum consumption, and the transportation sector accounts for more than four-fifths of Idaho's petroleum use.
- Per capita natural gas consumption in Idaho ranks among the lowest one-third of the states, despite about half of Idaho households using natural gas as their primary energy source for heating.
- Idaho consumes four times more energy than it produces, although its total energy use is among the 10 lowest states.
Last Updated: May 16, 2024
Data
Last Update: May 16, 2024 | Next Update: June 20, 2024
| Prices | |||||
|---|---|---|---|---|---|
| Petroleum | Idaho | U.S. Average | Period | find more | |
| Domestic Crude Oil First Purchase | -- | $ 74.83 /barrel | Feb-24 | ||
| Natural Gas | Idaho | U.S. Average | Period | find more | |
| City Gate | $ 2.98 /thousand cu ft | $ 4.52 /thousand cu ft | Feb-24 | find more | |
| Residential | $ 8.29 /thousand cu ft | $ 13.25 /thousand cu ft | Feb-24 | find more | |
| Coal | Idaho | U.S. Average | Period | find more | |
| Average Sales Price | -- | $ 54.46 /short ton | 2022 | ||
| Delivered to Electric Power Sector | -- | $ 2.48 /million Btu | Feb-24 | ||
| Electricity | Idaho | U.S. Average | Period | find more | |
| Residential | 11.26 cents/kWh | 16.10 cents/kWh | Feb-24 | find more | |
| Commercial | 9.14 cents/kWh | 12.81 cents/kWh | Feb-24 | find more | |
| Industrial | 7.03 cents/kWh | 7.81 cents/kWh | Feb-24 | find more | |
| Reserves | |||||
|---|---|---|---|---|---|
| Reserves | Idaho | Share of U.S. | Period | find more | |
| Crude Oil (as of Dec. 31) | -- | -- | 2021 | find more | |
| Expected Future Production of Dry Natural Gas (as of Dec. 31) | -- | -- | 2021 | find more | |
| Expected Future Production of Natural Gas Plant Liquids | -- | -- | 2021 | find more | |
| Recoverable Coal at Producing Mines | -- | -- | 2022 | find more | |
| Rotary Rigs & Wells | Idaho | Share of U.S. | Period | find more | |
| Natural Gas Producing Wells | -- | -- | 2020 | find more | |
| Capacity | Idaho | Share of U.S. | Period | ||
| Crude Oil Refinery Capacity (as of Jan. 1) | -- | -- | 2023 | ||
| Electric Power Industry Net Summer Capacity | 5,256 MW | 0.4% | Feb-24 | ||
| Supply & Distribution | |||||
|---|---|---|---|---|---|
| Production | Idaho | Share of U.S. | Period | find more | |
| Total Energy | 141 trillion Btu | 0.1% | 2021 | find more | |
| Crude Oil | 0 thousand barrels per day | 0.0% | Feb-24 | find more | |
| Natural Gas - Marketed | 2,580 million cu ft | * | 2022 | find more | |
| Coal | -- | -- | 2022 | find more | |
| Total Utility-Scale Net Electricity Generation | Idaho | Share of U.S. | Period | find more | |
| Total Net Electricity Generation | 1,295 thousand MWh | 0.4% | Feb-24 | ||
| Utility-Scale Net Electricity Generation (share of total) | Idaho | U.S. Average | Period | ||
| Petroleum-Fired | 0.0 % | 0.2 % | Feb-24 | find more | |
| Natural Gas-Fired | 37.2 % | 40.9 % | Feb-24 | find more | |
| Coal-Fired | NM | 13.8 % | Feb-24 | find more | |
| Nuclear | 0.0 % | 20.2 % | Feb-24 | find more | |
| Renewables | 62.2 % | 24.5 % | Feb-24 | ||
| Stocks | Idaho | Share of U.S. | Period | find more | |
| Motor Gasoline (Excludes Pipelines) | 8 thousand barrels | 0.1% | Feb-24 | ||
| Distillate Fuel Oil (Excludes Pipelines) | 385 thousand barrels | 0.4% | Feb-24 | find more | |
| Natural Gas in Underground Storage | -- | -- | Feb-24 | find more | |
| Petroleum Stocks at Electric Power Producers | 0 thousand barrels | 0.0% | Feb-24 | find more | |
| Coal Stocks at Electric Power Producers | 0 thousand tons | 0.0% | Feb-24 | find more | |
| Fueling Stations | Idaho | Share of U.S. | Period | ||
| Motor Gasoline | 652 stations | 0.6% | 2021 | ||
| Propane | 17 stations | 0.7% | Apr-24 | ||
| Electric Vehicle Charging Locations | 183 stations | 0.3% | Apr-24 | ||
| E85 | 3 stations | 0.1% | Apr-24 | ||
| Biodiesel, Compressed Natural Gas, and Other Alternative Fuels | 3 stations | 0.1% | Apr-24 | ||
| Consumption & Expenditures | |||||
|---|---|---|---|---|---|
| Summary | Idaho | U.S. Rank | Period | ||
| Total Consumption | 574 trillion Btu | 41 | 2021 | find more | |
| Total Consumption per Capita | 301 million Btu | 23 | 2021 | find more | |
| Total Expenditures | $ 7,725 million | 39 | 2021 | find more | |
| Total Expenditures per Capita | $ 4,057 | 24 | 2021 | find more | |
| by End-Use Sector | Idaho | Share of U.S. | Period | ||
| Consumption | |||||
| » Residential | 140 trillion Btu | 0.7% | 2021 | find more | |
| » Commercial | 92 trillion Btu | 0.5% | 2021 | find more | |
| » Industrial | 172 trillion Btu | 0.5% | 2021 | find more | |
| » Transportation | 170 trillion Btu | 0.6% | 2021 | find more | |
| Expenditures | |||||
| » Residential | $ 1,366 million | 0.5% | 2021 | find more | |
| » Commercial | $ 776 million | 0.4% | 2021 | find more | |
| » Industrial | $ 1,236 million | 0.5% | 2021 | find more | |
| » Transportation | $ 4,346 million | 0.7% | 2021 | find more | |
| by Source | Idaho | Share of U.S. | Period | ||
| Consumption | |||||
| » Petroleum | 37 million barrels | 0.5% | 2021 | find more | |
| » Natural Gas | 139 billion cu ft | 0.4% | 2022 | find more | |
| » Coal | 76 thousand short tons | * | 2022 | find more | |
| Expenditures | |||||
| » Petroleum | $ 5,047 million | 0.7% | 2021 | find more | |
| » Natural Gas | $ 983 million | 0.4% | 2022 | find more | |
| » Coal | $ 14 million | 0.1% | 2022 | find more | |
| Consumption for Electricity Generation | Idaho | Share of U.S. | Period | find more | |
| Petroleum | 0 thousand barrels | 0.0% | Feb-24 | find more | |
| Natural Gas | 3,769 million cu ft | 0.4% | Feb-24 | find more | |
| Coal | NM | NM | Feb-24 | find more | |
| Energy Source Used for Home Heating (share of households) | Idaho | U.S. Average | Period | ||
| Natural Gas | 51.4 % | 46.2 % | 2022 | ||
| Fuel Oil | 1.3 % | 3.9 % | 2022 | ||
| Electricity | 35.4 % | 41.3 % | 2022 | ||
| Propane | 5.1 % | 5.0 % | 2022 | ||
| Other/None | 6.8 % | 3.5 % | 2022 | ||
| Environment | |||||
|---|---|---|---|---|---|
| Renewable Energy Capacity | Idaho | Share of U.S. | Period | find more | |
| Total Renewable Energy Electricity Net Summer Capacity | 338,829 MW | 100.3% | Feb-24 | ||
| Ethanol Plant Nameplate Capacity | 60 million gal/year | 0.3% | 2023 | ||
| Renewable Energy Production | Idaho | Share of U.S. | Period | find more | |
| Utility-Scale Hydroelectric Net Electricity Generation | 499 thousand MWh | 2.5% | Feb-24 | ||
| Utility-Scale Solar, Wind, and Geothermal Net Electricity Generation | 266 thousand MWh | 0.5% | Feb-24 | ||
| Utility-Scale Biomass Net Electricity Generation | 35 thousand MWh | 0.9% | Feb-24 | ||
| Small-Scale Solar Photovoltaic Generation | 15 thousand MWh | 0.3% | Feb-24 | ||
| Fuel Ethanol Production | 242 thousand barrels | 0.1% | 2021 | ||
| Renewable Energy Consumption | Idaho | U.S. Rank | Period | find more | |
| Renewable Energy Consumption as a Share of State Total | 25.5 % | 10 | 2021 | ||
| Fuel Ethanol Consumption | 1,964 thousand barrels | 38 | 2021 | ||
| Total Emissions | Idaho | Share of U.S. | Period | find more | |
| Carbon Dioxide | 20.5 million metric tons | 0.4% | 2021 | ||
| Electric Power Industry Emissions | Idaho | Share of U.S. | Period | find more | |
| Carbon Dioxide | 2,287 thousand metric tons | 0.1% | 2022 | ||
| Sulfur Dioxide | 3 thousand metric tons | 0.3% | 2022 | ||
| Nitrogen Oxide | 4 thousand metric tons | 0.3% | 2022 | ||
Analysis
Last Updated: May 16, 2024
Overview
Idaho has many renewable energy resources, but few fossil fuel reserves.
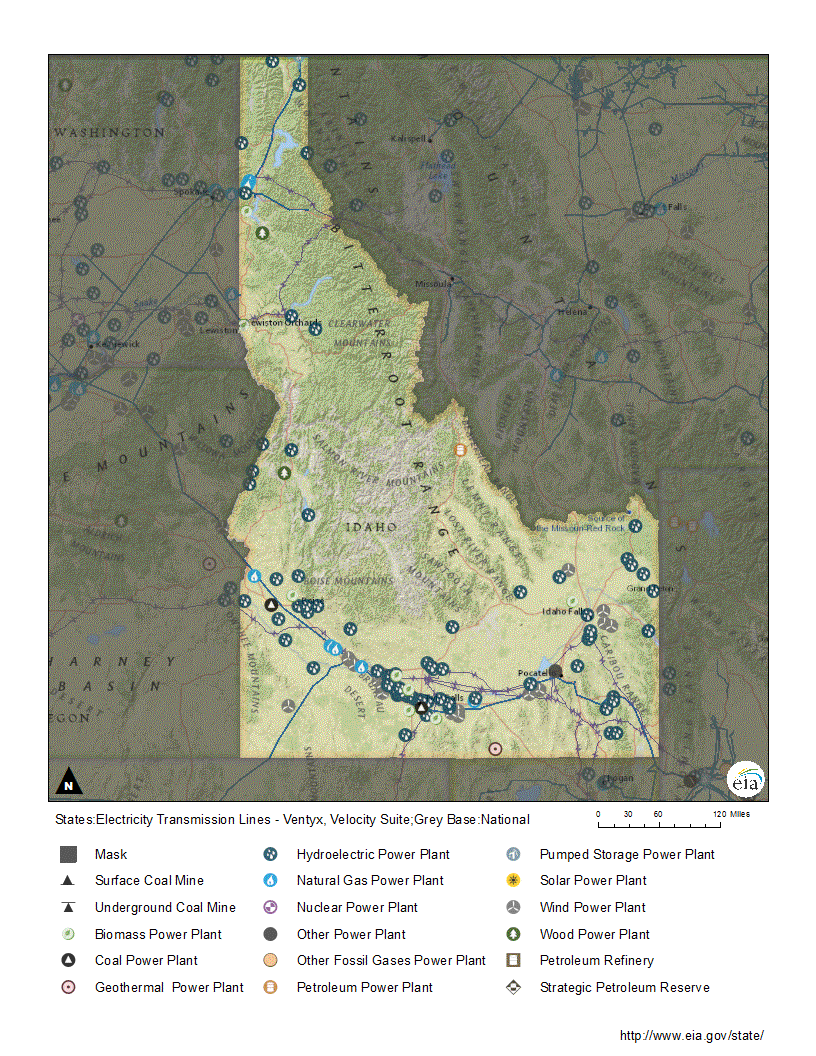
Idaho, known as the Gem State, is rich in silver, gold, cobalt, and many other minerals, but the state has few fossil fuel reserves.1,2,3,4 Idaho's energy potential lies in its substantial renewable energy resources, including hydropower, wind, solar, biomass, and geothermal.5 Because of the state's northerly latitude and its location in the interior of North America far from large bodies of water, Idaho has large seasonal temperature swings leading to cold winters and warm summers.6 Mountains cover much of Idaho from its border with Canada in the north to Nevada and Utah in the south. The mountains capture moisture-laden clouds that move east from the Pacific Ocean, and produce deep mountain snowfalls that feed the state's fast-running rivers.7 Idaho's river valleys, which offered passage through the rugged mountains for early pioneer settlers, today give the state a wealth of hydroelectric and wind energy resources.8,9,10 The plains flanking Idaho's Snake River stretch in an arc all the way across the southern part of the state from the Teton Mountains on the Wyoming border to Hells Canyon at the Oregon border.11 The valleys of the Snake River and its tributaries are home to most of Idaho's small population, more than two-fifths of whom live in the Boise area. Vast stretches of Idaho remain wilderness.12,13,14
Idaho consumes four times more energy than it produces.15 Its total energy consumption is among the 10 lowest states, but its per capita use ranks near the middle of the 50 states. The energy intensity of Idaho's economy—the amount of energy used to produce each dollar of GDP—is near the top two-fifths of the states.16,17 The industrial sector and the transportation sector each accounts for about 30% of the state's total energy use, followed by the residential sector at 24%, and the commercial sector at 16%.18 Real estate, manufacturing, healthcare, and construction are among the largest contributors to Idaho's GDP. Other contributors to the state's economy are the energy-intensive agriculture, food processing, mining, and chemicals sectors.19,20
Renewable energy
In 2023, Idaho ranked fifth among the states in the share of total electricity generated from renewable energy.
In 2023, renewable energy resources generated 68% of Idaho's total in-state electricity, including from customer-sited, small-scale solar panel generating systems (less than 1 megawatt capacity). The renewable energy share was the fifth-highest for any state, after Vermont, South Dakota, Washington, and Maine. Most of Idaho's renewable electricity comes from hydropower.21,22 Hydropower fuels 4 of Idaho's 10 largest generating facilities by capacity. Based on actual generation, 5 of the largest 10 power plants are hydroelectric dams.23
In 2023, hydropower provided 43% of Idaho's total in-state electricity generation.24 Half of Idaho's utility-scale (1 megawatt or larger) electricity generating capacity is at hydroelectric power plants.25,26 The nation's largest privately-owned conventional hydroelectric generating facility, the Brownlee plant, is on the Idaho-Oregon border. The three-dam complex, owned by Idaho Power, is on the Snake River in Hells Canyon, which is the deepest river gorge in North America.27,28
Although only a small amount of the state's land area is suitable for wind power development, Idaho has substantial wind energy potential in the southern half of the state along the Snake River and on mountain ridges across the state.29 Idaho's wind farms are located on the Snake River Plain.30 In 2023, about 15% of the state's total in-state electricity net generation came from wind facilities, whose total combined generating capacity was nearly 1,000 megawatts. Idaho's electricity generation from utility-scale wind power farms began in 2005. The state's 10th-largest electricity generating facility by capacity is a 125-megawatt wind farm with 83 turbines. Idaho's largest wind farm, with 160-megawatts of capacity, came online in the spring of 2024.31,32,33,34,35
Idaho's first utility-scale solar power generation began in 2016, when three solar power generating facilities came online.36,37 The largest solar farm by capacity, with 120 megawatts of generating capacity, began operating at the end of 2022. Solar heating and small-scale, customer-sited solar panel generating systems can be found in the state's cities and rural areas. Nearly four-fifths of Idaho's solar PV electricity generation came from utility-scale facilities in 2023, when total solar power accounted for 7% of the state's net generation.38,39
About two-fifths of Idaho is covered by forests.40 Biomass, primarily wood waste from those forests, provided about 3% of the state's total electricity generation in 2023. Other waste biomass and landfill gas also generate electricity in the state.41,42 Idaho's eighth-largest power plant, based on annual generation, is fueled with wood.43 The state's biomass resources also provide feedstock for Idaho's three wood pellet manufacturing plants, which have a combined production capacity of 74,000 tons per year.44
In 2023, Idaho was one of seven states with utility-scale electricity generation from geothermal energy.45 Although geothermal energy provides less than 1% of the state's total generation, Idaho's volcanic landscape has some of the best geothermal potential in the nation.46 The state has many hot springs and other geothermal resources that have long been used as direct heat sources for aquaculture, greenhouses, spas, resorts, and city district heating. In 2008, the first commercial geothermal power plant in the U.S. Northwest came online in south-central Idaho. The 10-megawatt capacity facility is the state's only geothermal power plant.47,48,49
Idaho does not have a renewable portfolio standard (RPS) that requires a specific amount of electricity to be generated from renewable sources of energy by a certain date.50 However, the state offers low-interest loans for energy efficiency and renewable energy projects and tax deductions for small-scale renewable energy-fueled devices used for residential heating or electricity generation.51,52 While there is no statewide net metering policy, each of Idaho's three investor-owned electric utilities offers net metering programs for small-scale, customer-sited renewable generation. Idaho's commercial, residential, and agricultural customers are all eligible for net metering.53,54,55
Electricity
Hydroelectric power plants typically supplied more than two-thirds of Idaho's total in-state electricity generation until 2012. However, since 2012, drought and increased generation from other renewables have reduced hydropower's share of the state's total annual generation to less than half. The balance of Idaho's in-state generation is supplied mostly by natural gas and wind power. In 2023, natural gas fueled 32% of Idaho's electricity generation and wind accounted for 15%. Solar power, biomass-fueled facilities, and geothermal energy collectively provided about 10% of the state's generation.56,57
Three large investor-owned electric utilities supply about four-fifths of the state's electricity. About two dozen municipal utilities and rural electric cooperatives provide the rest. They buy almost all of their electricity from the Bonneville Power Administration (BPA), which markets power mainly from hydroelectric facilities at federal dams and other facilities in the Pacific Northwest.58,59 About two-fifths of the electricity consumed in Idaho arrives over interstate transmission lines from out-of-state generating facilities owned by Idaho utilities and from the BPA.60,61,62
Idaho has not generated any utility-scale electricity from coal since early 2022. Although there is no in-state coal-fired electricity generation, Idaho's utilities bring in electricity from coal-fired power plants in neighboring states.63,64,65 A coal-fired power plant in Oregon that supplied electricity to Idaho closed in 2020, and other coal-fired generation in neighboring states are set to shut down over the next several years. Idaho's largest electric utility plans to end its coal-fired power generation purchases by 2028.66,67,68
The state has no commercial nuclear power plants, but the U.S. Department of Energy's Idaho National Laboratory (INL), a federal nuclear energy research center and one of the state's largest employers, was the site of the nation's first nuclear power plant. It first generated electricity in 1951.69,70,71 Plans to build on the INL site by 2029 the first power plant with six small modular nuclear reactors—each with 77 megawatts of generating capacity-were canceled in November 2023.72,73,74,75
The Pacific Northwest's transmission lines are increasingly congested, and projects are under way to expand capacity both to supply Idaho with electricity and to transport power among several western states including Wyoming, Idaho, and Oregon. In the near term, most new generating capacity planned in the region will be fueled by solar and wind energy. New transmission projects will also enable development of the region's remote renewable resources.76,77
Idaho has the third-lowest average electricity price of any state.
Idaho has the nation's third-lowest average residential electricity price, after North Dakota and Washington, in part because of the large amount of the state's generation that comes from relatively inexpensive hydropower.78 In 2023, the largest share of Idaho's electricity sales went to the residential sector—which accounted for 38% of the state's total—followed closely by the industrial sector at almost 35% and the commercial sector at 27%.79 About one-third of Idaho households use electricity as their primary energy source for home heating.80
Petroleum
Idaho does not have significant proved crude oil reserves, and it produces a very small amount of crude oil.81,82 Exploration for crude oil in Idaho began in 1903, but despite promising geology in the state's southeast and southwest, no commercial reserves were discovered or produced until the past decade.83 Since 2015, the small amounts of crude oil that are produced come from wells drilled primarily for natural gas.84,85
Idaho has no petroleum refineries.86 Refined petroleum products come from nearby states. Two major petroleum product pipelines cross the state. One pipeline in southern Idaho runs west through the Snake River Valley from refineries in Utah and another pipeline crosses the northern part of the state from refineries in Montana. Only the southern pipeline system delivers refined products to terminals in Idaho.87
Idaho’s total petroleum consumption is among the lowest 10 states.
In part because of its small population, Idaho's total petroleum consumption is among the lowest 10 states.88 The transportation sector uses slightly more than four-fifths of the petroleum consumed in the state, the industrial sector uses about one-tenth, and the residential and commercial sectors consume the rest.89 About 6 in 100 Idaho households use fuel oil, kerosene, or propane for home heating.90 Conventional motor gasoline without ethanol can be sold statewide, but as is the case in most states, almost all the motor gasoline sold in Idaho contains at least 10% ethanol.91,92 The state has one ethanol plant, which produces about 10 million gallons a year, much less than Idaho's annual fuel ethanol consumption of about 76 million gallons.93,94,95
Natural gas
Idaho does not have any significant natural gas reserves.96 Natural gas discoveries in 2010 led to the state's first commercial natural gas production in 2015.97,98 Output so far is modest and fell sharply in 2020, down about 90% from 2019, due in part to a decline in drilling activity during the COVID-19 pandemic. However, the state's natural gas production was nearly 13 times greater in 2021 and then nearly doubled in 2022.99,100 Idaho consumers receive most of their natural gas supply by interstate pipeline, primarily from Canada and Utah. About 90% of the natural gas that enters Idaho leaves the state, with almost all of it going to Washington.101 One natural gas pipeline system enters Idaho at its northern border with Canada, crosses the state's panhandle, and continues to Washington, Oregon, and California. Another pipeline system runs from the San Juan Basin in southwestern Colorado across Idaho's Snake River Plain on its way to the Pacific Northwest and Canada. That system is bi-directional, so it can supply natural gas to Idaho either from Canada or from Wyoming and Colorado.102,103,104 Idaho has no natural gas underground storage sites.105
Idaho's total natural gas consumption ranks among the 10 lowest states, and its per capita natural gas consumption ranks among the lowest one-third of the states, despite the prevalence of natural gas use for heating during the state's extremely cold winters.106 In 2023, the industrial and electric power sectors were the largest natural gas consumers in Idaho, with each accounting for 29% of the state's natural gas use. The residential sector made up 26% of natural gas use, as about half of Idaho households use natural gas as their primary energy source for heating. The commercial sector accounted for 17% of the state's natural gas consumption.107,108
Coal
Idaho has a small amount of estimated recoverable coal reserves, but the state does not have any commercial coal production.109,110 There are no longer any operating utility-scale coal-fired power plants in Idaho, but small amounts of coal are shipped to the state's industrial users by rail and truck from Utah, Colorado, and Pennsylvania.111,112
Endnotes
1 Idaho State University, Idaho Museum of Natural History, Mining in Idaho, accessed April 3, 2024.
2 Holtz, Michael, "Idaho is sitting on One of the Most Important Elements on Earth," The Atlantic (January 24, 2022).
3 U.S. Energy Information Administration (EIA), Annual Coal Report 2022 (October 3, 2023), Table 15, Recoverable Coal Reserves at Producing Mines, Estimated Recoverable Reserves, and Demonstrated Reserve Base by Mining Method, 2022.
4 U.S. EIA, U.S. Crude Oil and Natural Gas Proved Reserves, Year-end 2022, Tables 6, 8.
5 Idaho Governor's Office of Energy and Mineral Resources, Renewable Energy, accessed April 3, 2024.
6 NOAA National Centers for Environmental Information, State Climate Summaries 2022, Idaho.
7 Qualls, Russell, "Idaho Contrasts from Mountains to Plains," Community Collaborative Rain, Hail and Snow Network, State Climates Series, accessed April 3, 2024.
8 U.S. Department of the Interior, National Park Service, National Historic Trails, Auto Tour Route Interpretive Guide, Along the Snake River Plain Through Idaho, The Tangle of Trails Through Idaho (October 2008), p. 7-10.
9 Idaho Governor's Office of Energy and Mineral Resources, Hydroelectric, accessed April 3, 2024.
10 U.S. Department of Energy, Energy Efficiency and Renewable Energy, WINDExchange, Wind Energy in Idaho, Maps & Data, accessed April 3, 2024.
11 World Atlas, Idaho, accessed April 3, 2024.
12 U.S. Census Bureau, 2020 Census: Idaho Profile.
13 U.S. Census Bureau, American Community Survey, Table B01003, Total Population, 2022: ACS 1-Year Estimates Detailed Tables, Idaho and Boise City, ID Metro Area.
14 Sangres.com, National Wilderness Areas in Idaho, accessed April 3, 2024.
15 U.S. EIA, State Energy Data System, Table P3, Total Primary Energy Production and Total Energy Consumption Estimates in Trillion Btu, 2021.
16 U.S. EIA, State Energy Data System, Table C14, Total Energy Consumption Estimates per Capita by End-Use Sector, Ranked by State, 2021.
17 U.S. EIA, State Energy Data System, Table C10, Total Energy Consumption Estimates, Real Gross Domestic Product (GDP), Energy Consumption Estimates per Real Dollar of GDP, Ranked by State, 2021.
18 U.S. EIA, State Energy Data System, Table C11, Total Energy Consumption Estimates by End Use Sector, Ranked by State, 2021.
19 NETSTATE, Idaho Economy, accessed April 3, 2024.
20 U.S. Bureau of Economic Analysis, Tools, Interactive Data, Regional Data, GDP and Personal Income, Annual Gross Domestic Product (GDP) by State, SAGDP2 GDP in current dollars, Idaho, All Statistics in Table, Idaho, 2022.
21 U.S. EIA, Electricity Data Browser, Idaho, net generation for all sectors (thousand megawatthours), Annual, 2001-23.
22 U.S. EIA, Electric Power Monthly (February 2024), Tables 1.3.B, 1.10.B, 1.11.B.
23 U.S. EIA, Idaho Electricity Profile 2022, Table 2A, Ten largest plants by capacity, 2022, and Table 2B, Ten largest plants by generation, 2022.
24 U.S. EIA, Electricity Data Browser, Idaho, net generation for all sectors (thousand megawatthours), Annual, 2001-23.
25 U.S. EIA, Preliminary Monthly Electric Generator Inventory (based on Form EIA-860M as a supplement to Form EIA-860), Inventory of Operating Generators as of March 2024, Plant State: Idaho, Technology: All, Conventional Hydroelectric.
26 U.S. EIA, Idaho Electricity Profile 2022, Table 2B, Ten largest plants by generation, 2022.
27 Idaho Power, Hydroelectric, accessed April 15, 2024.
28 U.S. Forest Service, Hells Canyon National Recreation Area, Hells Canyon Overview, accessed April 15, 2024.
29 U.S. Department of Energy, Energy Efficiency and Renewable Energy, WINDExchange, Wind Energy in Idaho, Maps and Data, accessed April 15, 2024.
30 U.S. EIA, U.S. Energy Atlas, All Energy Infrastructure and Resources, Idaho, Wind Power Plants, accessed April 15, 2024.
31 U.S. EIA, Electricity Data Browser, Idaho, net generation or all sectors (thousand megawatthours), Annual, 2001-23.
32 U.S. EIA, Idaho Electricity Profile 2022, Table 2A, Ten largest plants by capacity, 2022.
33 U.S. EIA, Preliminary Monthly Electric Generator Inventory (based on Form EIA-860M as a supplement to Form EIA-860), Inventory of Operating Generators as of March 2024, Plant State: Idaho, Technology: Onshore Wind Turbine.
34 Renewable Technology, Goshen North Wind Farm, Idaho, accessed April 15, 2024.
35 Calder, Tylor, "Clearway Energy Group announces 152-megawatt wind farm now up and running near Firth," Idaho State Journal (April 11, 2024).
36 U.S. EIA, Electricity Data Browser, Idaho, net generation for all sectors (thousand megawatthours), Annual, 2001-23.
37 U.S. EIA, Preliminary Monthly Electric Generator Inventory (based on Form EIA-860M as a supplement to Form EIA-860), Inventory of Operating Generators as of March 2024, Plant State: Idaho, Technology: Solar Photovoltaic.
38 Idaho Governor's Office of Energy and Mineral Resources, Solar, accessed April 15, 2024.
39 U.S. EIA, Electricity Data Browser, Idaho, net generation for all sectors (thousand megawatthours), Annual, 2001-23.
40 Idaho Forest Products Commission, Forest Information Topic: Idaho's Forests, accessed April 16, 2024.
41 U.S. EIA, Preliminary Monthly Electric Generator Inventory (based on Form EIA-860M as a supplement to Form EIA-860), Inventory of Operating Generators as of March 2024, Plant State: Idaho, Technology: Landfill Gas, Other Waste Biomass, Wood/Wood Waste Biomass.
42 U.S. EIA, Electricity Data Browser, Idaho, net generation for all sectors (thousand megawatthours), Annual, 2001-23.
43 U.S. EIA, Idaho Electricity Profile 2022, Table 2B, Ten largest plants by generation, 2022.
44 U.S. EIA, Monthly Densified Biomass Fuel Report (April 1, 2024), Table 1, Densified biomass fuel manufacturing facilities in the United States by state, region, and capacity, January 2024, Download.
45 U.S. EIA, Electric Power Monthly (February 2024), Table 1.16.B.
46 U.S. EIA, Electricity Data Browser, Idaho, net generation for all sectors (thousand megawatthours), Annual, 2001-23.
47 Idaho Governor's Office of Energy and Mineral Resources, Geothermal, accessed April 16, 2024.
48 Idaho Governor's Office of Energy and Mineral Resources, Idaho Energy Landscape 2021, p. 41-42.
49 U.S. EIA, Preliminary Monthly Electric Generator Inventory (based on Form EIA-860M as a supplement to Form EIA-860), Inventory of Operating Generators as of March 2024, Plant State: Idaho, Technology: Geothermal.
50 National Conference of State Legislatures, State Renewable Portfolio Standards and Goals, updated August 13, 2021.
51 NC Clean Energy Technology Center, DSIRE, Idaho, Low-Interest Energy Loan Programs, updated August 28, 2023.
52 NC Clean Energy Technology Center, DSIRE, Idaho, Residential Alternative Energy Tax Deduction, updated March 15, 2023.
53 NC Clean Energy Technology Center, DSIRE, Idaho Power, Net Metering, updated February 13, 2023.
54 NC Clean Energy Technology Center, DSIRE, Rocky Mountain Power, Net Metering, updated February 14, 2023.
55 NC Clean Energy Technology Center, DSIRE, Avista Utilities, Net Metering, updated February 14, 2023.
56 U.S. EIA, Electricity Data Browser, Idaho, net generation for all sectors (thousand megawatthours), Annual, 2001-23.
57 U.S. EIA, "Western U.S. hydropower generation fell to a 22-year low last year," Today in Energy (March 26, 2024).
58 Idaho Governor's Office of Energy and Mineral Resources, Idaho Energy Landscape 2021, p. 10-15, 63.
59 Bonneville Power Administration, About, accessed April 16, 2024.
60 U.S. EIA, Idaho Electricity Profile 2022, Table 10, Supply and disposition of electricity, 1990 through 2022.
61 Idaho Power, How We Get Electricity to You, accessed April 16, 2024.
62 Idaho Governor's Office of Energy and Mineral Resources, Idaho Energy Landscape 2021, p. 27-28.
63 U.S. EIA, Electricity Data Browser, Idaho, net generation for all sectors (thousand megawatthours), Annual, 2001-23.
64 Idaho Coal, Our Pathway Away from Coal, accessed April 17, 2024.
65 Idaho Governor's Office of Energy and Mineral Resources, Coal, accessed April 17, 2024.
66 Idaho Power, Coal, accessed April 17, 2024.
67 U.S. EIA, Preliminary Monthly Electric Generator Inventory (based on Form EIA-860M as a supplement to Form EIA-860), Inventory of Operating Generators as of March 2024, Plant State: Montana, Utah, Washington: Technology: Conventional Steam Coal, planned retirement year.
68 Ridler, Keith, "Idaho Power cuts coal by 2028 in plan to state regulators," Associated Press (January 4, 2022).
69 U.S. EIA, Nuclear Reactor, State, and Net Capacity, accessed April 17, 2024.
70 Idaho National Laboratory, The World's First Nuclear Power Plant, accessed April 17, 2024.
71 Idaho National Laboratory, Economic Impact Summary, FY 2022 Idaho National Laboratory.
72 Idaho Governor's Office of Energy and Mineral Resources, Nuclear, accessed April 17, 2024.
73 NuScale, "NuScale Reaches Key Milestone in the Development of the Carbon Free Power Project," Press Release (January 9, 2023).
74 "Eastern Idaho nuclear project goes from 12 to six reactors," Associated Press (July 19, 2021).
75 Bright, Zach, "NuScale cancels first-of-a-kind nuclear project as costs surge," E&E News (November 11, 2023).
76 Idaho Governor's Office of Energy Resources, Energy Infrastructure, Transmission Line Projects, accessed April 17, 2024.
77 U.S. EIA, Preliminary Monthly Electric Generator Inventory (based on Form EIA-860M as a supplement to Form EIA-860), Inventory of Planned Generators as of March 2024, Plant State: Idaho, Oregon, Washington, Technology: All.
78 U.S. EIA, Electric Power Monthly (February 2024), Table 5.6.B.
79 U.S. EIA, Electricity Data Browser, Idaho, Retail Sales of Electricity (million kilowatthours), 2001-23.
80 U.S. Census Bureau, House Heating Fuel, Table B25040, 2022 ACS 1-Year Estimates Detailed Tables, Idaho.
81 U.S. EIA, U.S. Crude Oil and Natural Gas Proved Reserves, Year-end 2022, Table 6.
82 U.S. EIA, Crude Oil Production, Annual, 2018-23.
83 Barton, Mark, "Idaho Geological Survey Oil & Gas Program," Idaho Geological Survey (November 2019), slide 4.
84 Barker, Rocky, "Idaho Has Become an Oil-Producing State," Idaho Statesman (June 28, 2016).
85 U.S. EIA, Idaho Field Production of Crude Oil, Annual, 2007-2023.
86 U.S. EIA, Refinery Capacity Report (June 21, 2023), Table 3, Capacity of Operable Petroleum Refineries by State as of January 1, 2023.
87 U.S. Department of Energy, Office of Electricity Delivery and Energy Reliability, State of Idaho Energy Sector Risk Profile, Petroleum, p. 4, accessed April 18, 2024.
88 U.S. EIA, State Energy Data System, Table C15, Petroleum Consumption, Total and per Capita, Ranked by State, 2021.
89 U.S. EIA, State Energy Data System, Table F16, Total Petroleum Consumption Estimates, 2022.
90 U.S. Census Bureau, House Heating Fuel, Table B25040, 2022 ACS 1-Year Estimates Detailed Tables, Idaho.
91 American Petroleum Institute, U.S. Gasoline Requirements Map, updated January 2018.
92 U.S. EIA, "Almost all U.S. gasoline is blended with 10% ethanol," Today in Energy (May 4, 2016).
93 U.S. EIA, U.S. Fuel Ethanol Plant Production Capacity (August 7, 2023), Detailed annual production capacity by plant is available in XLS file.
94 U.S. EIA, State Energy Data System, Table P1, Primary Energy Production Estimates in Physical Units, 2021.
95 U.S. EIA, State Energy Data System, Table F25, Fuel ethanol consumption estimates, 2022.
96 U.S. EIA, U.S. Crude Oil and Natural Gas Proved Reserves, Year-end 2022, Table 8.
97 Dunnahoe, Tayvis, "Idaho enters ranks of hydrocarbon producing states," Oil and Gas Journal (February 6, 2017).
98 U.S. EIA, Natural Gas Gross Withdrawals and Production, Idaho Gross Withdrawals of Natural Gas, Annual 2015-22.
99 U.S. EIA, Natural Gas Gross Withdrawals and Production, Idaho, Annual-Million Cubic Feet, 2017-22.
100 U.S. EIA, "U.S. natural gas production decreased by 1% in 2020," Today in Energy (March 2, 2021).
101 U.S. EIA, International and Interstate Movements of Natural Gas by State, Idaho, 2017-22.
102 Idaho Public Utilities Commission, Major Natural Gas Pipelines and Local Gas Distribution Companies, accessed April 19, 2024.
103 Idaho Governor's Office of Energy and Mineral Resources, Idaho Energy Landscape 2021, p. 16-18.
104 Williams, Operations, Transmission & Gulf of Mexico, Overview, Northwest Pipeline, accessed April 19, 2024.
105 U.S. EIA, Underground Natural Gas Storage Capacity, 2017-22.
106 U.S. EIA, State Energy Data System, Table C16, Natural Gas Consumption, Total and per Capita, Ranked by State, 2021.
107 U.S. EIA, Natural Gas Consumption by End Use, Idaho, Annual, 2018-23.
108 U.S. Census Bureau, House Heating Fuel, Table B25040, 2022 ACS 1-Year Estimates Detailed Tables, Idaho.
109 U.S. EIA, Annual Coal Report 2022 (October 3, 2023), Table 15, Recoverable Coal Reserves at Producing Mines, Estimated Recoverable Reserves, and Demonstrated Reserve Base by Mining Method, 2022.
110 U.S. EIA, Annual Coal Report 2022 (October 3, 2023), Table 1, Coal Production and Number of Mines by State and Mine Type, 2022 and 2021.
111 U.S. EIA, Preliminary Monthly Electric Generator Inventory (based on Form EIA-860M as a supplement to Form EIA-860), Inventory of Operating Generators as of March 2024, Plant State: Idaho, Technology: Conventional Steam Coal.
112 U.S. EIA, Annual Coal Distribution Report 2022 (October 3, 2023), Domestic distribution of U.S. coal by destination State, consumer, destination and method of transportation, Idaho, Table DS-10, Domestic Coal Distribution, by Destination State, 2022.
Other Resources
Energy-Related Regions and Organizations
- Petroleum Administration for Defense District (PADD): 4
- North American Electric Reliability Corporation (NERC) ERO Enterprise: Regional Entities: Western Electricity Coordinating Council (WECC)
Other Websites
- Idaho Governor's Office of Energy and Mineral Resources
- Idaho Public Utilities Commission
- Idaho Department of Lands, Oil and Gas Conservation Commission
- Idaho Department of Lands, Oil & Gas Leasing
- EIA Idaho Flickr Album
- Idaho Department of Heath & Welfare, Heating Assistance (Seasonal & Crisis)
- Idaho Department of Heath & Welfare, Weatherize Home
- Idaho Geological Survey, Geothermal Resources
- Idaho National Laboratory
- Idaho Leadership in Nuclear Energy Commission
- Idaho Governor's Office of Energy and Mineral Resources, State Energy Loan Program
- Northwest Power and Conservation Council, Power Supply
- Alternative Fuels Data Center, Federal and State Laws and Incentives
- Benefits.Gov, Housing and Public Utilities
- NC Clean Energy Technology Center, Database of State Incentives for Renewables and Efficiency (DSIRE)
- National Association of Regulatory Utility Commissioners (NARUC)
- National Association of State Energy Officials (NASEO)
- National Conference of State Legislatures (NCSL), Research and Policy
- National Renewable Energy Laboratory (NREL), Geospatial Data Science Data and Tools
- U.S. Geological Survey (USGS), Publications
- Interstate Oil and Gas Compact Commission
- Western Interstate Energy Board
- Western Governors Association
- Bonneville Power Administration
- U.S. Department of Health & Human Services, Office of Community Services, An Office of the Administration for Children & Families, Low Income Energy Assistance Program (LIHEAP)
- U.S. Geological Survey, Maps
- Lawrence Livermore National Laboratory, Energy Flow Charts
- National Renewable Energy Laboratory, State and Local Planning for Energy (SLOPE)
- EIA Natural Gas Storage Dashboard
- EIA Energy Disruptions
- U.S. Department of Agriculture (USDA), Rural Development, Energy Programs
- Idaho Department of Environmental Quality, Regulated Underground Storage Tanks