Analysis of Projected Crude Oil Production in the Arctic National Wildlife Refuge
Release Date: 5/23/18
In December 2017, the passage of Public Law 115-97[1] required the Secretary of the Interior to establish and administer a competitive oil and natural gas program for the leasing, development, production, and transportation of oil and natural gas in and from the coastal plain (1002 Area)[2] of the Arctic National Wildlife Refuge (ANWR). Previously, ANWR was effectively under a drilling moratorium. Because this law was passed after the modeling for the Annual Energy Outlook 2018 (AEO2018) was completed, this article investigates the impact of this law change on the Reference case projections in the AEO2018.[3]
The middle resource case (Mean ANWR) presented in this article includes the consideration of the law change and shows an increase of 3.4 billion barrels in cumulative U.S. crude oil production from 2031 to 2050 compared with the AEO2018 Reference case. Production from ANWR does not start until 2031 because of the time needed to acquire leases, explore, and develop the required production infrastructure. The crude oil prices in the Mean ANWR case are sufficiently high to support development given the assumed resource base and cost estimates.
Much uncertainty surrounds the ANWR projections because production has not yet occurred in the area. The only well drilled in the coastal plain was completed in 1986, and the results have remained confidential. Federal resource estimates are based largely on the oil productivity of geologic formations in neighboring state lands in Alaska and two-dimensional seismic data that had been collected by a petroleum industry consortium in 1984 and 1985. This article addresses this resource uncertainty by presenting two alternate ANWR cases that reflect a lower and higher crude oil resource base than in the Mean ANWR case.
Beyond resource uncertainty, market dynamics could limit the amount of increased Alaskan production processed domestically. Demand for gasoline declines on the West Coast through most of the AEO2018 Reference Case projection period, which could mean less demand for additional Alaskan crude oil to be processed in its traditional market. Substituting Alaskan crude oil for the heavier crude oils historically processed in California would reduce the profitability of refinery coking and could lead to refinery closures. The availability of vessels compliant with the Merchant Marine Act of 1920 (Jones Act)[4] and constraints through high-traffic waterways on the West Coast could also limit the amount of Alaskan crude oil that gets processed in domestic refineries. Given these factors, it is likely that some additional volumes of Alaskan oil production would be exported to Asia.
Background
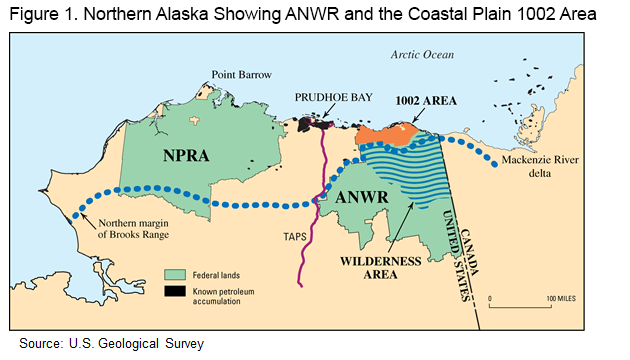
ANWR is located on the northern coast of Alaska due east of both Prudhoe Bay and the National Petroleum Reserve-Alaska (NPRA) (Figure 1). The coastal plain (or 1002 Area) covers 1.5 million acres and is about 8% of the total area of ANWR. In its latest (1998) resource assessment, the United States Geological Survey (USGS) estimated that the total technically recoverable crude oil resource for federal lands, state waters, and native lands in the coastal plain has a 95% chance of being more than 5.7 billion barrels and a 5% chance of being as high as 16.0 billion barrels, with a mean estimate of 10.4 billion barrels.[5]
The effect of opening ANWR is highly uncertain because of several factors that affect the timing and cost of development, including:
- The resource base. Little direct knowledge is available on the petroleum geology of the ANWR region. The USGS oil resource estimates are based largely on the oil productivity of geologic formations that existed in the neighboring state lands in Alaska as of 1998 and two-dimensional seismic data that had been collected by a petroleum industry consortium in 1984 and 1985. Collection of seismic data within ANWR requires an act of Congress, and the current data are the only seismic data collected within Alaska’s coastal plain (1002 Area). Consequently, considerable uncertainty remains regarding the size and quality of the oil resources that exist in ANWR.
- Oil field sizes. The size of the oil fields in ANWR is one factor that will affect the rate at which ANWR crude oil resources are developed and produced. If the reservoirs are larger than assumed, production will be greater than projected. If the reservoirs are smaller than assumed, production will be lower than projected.
- The quality of the oil and the characteristics of the oil reservoirs. Oil field production rates are also determined by the quality of oil found (i.e., viscosity and paraffin content) and the field’s reservoir characteristics (i.e., its depth, permeability, faulting, and water saturation).
- Legislative environment. Other legislative and environmental restrictions could affect the timing of exploration and development. Also, legal challenges to the Bureau of Land Management’s (BLM) leasing program, approval of seismic data collection, and approval of specific oil field projects could significantly delay ANWR crude oil development and production.
- Competing opportunities. Conversion of technically recoverable resources to production will require considerable time and financial investment. Hostile weather conditions, coupled with limited weather windows during which to explore and drill, increase development and production costs, making Alaska one of the more capital-intensive drilling areas in the United States. Companies that have experience operating in the remote areas of Alaska have operations in the NPRA, where leasing has already begun, and they may prioritize investments in NPRA over ANWR.
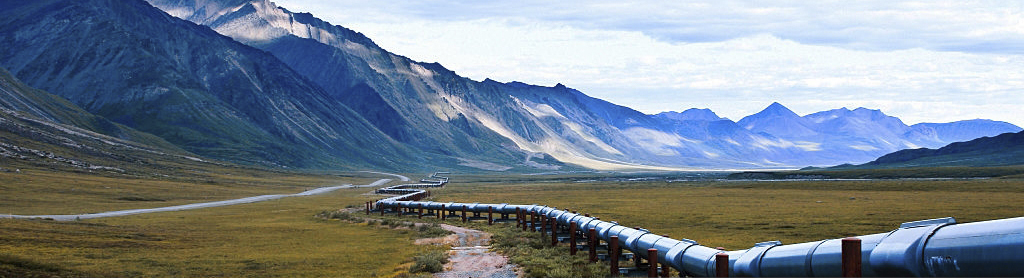
Alaska relies on the Trans-Alaska Pipeline System (TAPS), which marked its 40th anniversary in 2017, to transport crude oil from the frozen North Slope to the warm-water port at Valdez on the state's southern coast. The 800-mile pipeline was built from 1974 to 1977, and achieved peak flow in late 1980s at 2 million barrels per day (b/d). Current flow is near 500,000 b/d. Adding oil production from ANWR would help alleviate current challenges, including:
- Less oil production → slower flow → crude oil spends more time in pipe, and less turbulence is generated
- Slower flow/less turbulence → more wax may accumulate in the pipe, requiring more frequent cleaning
- More time in pipe → crude oil loses heat → higher risk of ice problems, more wax forms
Nearly 80% of oil produced in Alaska in 2017 was sent to Washington and California on Jones Act vessels at a shipping cost of about $5.50 per barrel. About 15% of Alaskan crude oil production was processed in Alaska. A small amount of Alaskan crude oil was shipped to Hawaii or exported to international destinations in 2017.
Methodology
The effects of opening the Coastal Plain area of ANWR are determined in the Alaska Oil and Gas Supply Submodule (AOGSS) in EIA’s Oil and Gas Supply Module of the National Energy Modeling System (NEMS). The AOGSS is used to project the exploration and development of undiscovered oil resources in Alaska.[6] The crude oil price and the transportation costs to Southern California refineries are used to calculate an estimated wellhead (netback) oil price. A discounted cash flow (DCF) calculation is used to determine the economic viability of Alaskan drilling and production activities. The exploration, discovery, and development of new oil fields in ANWR ultimately will depend on the assumed timing of development, the assumed field size distribution and production profile for each field size, and the expected profitability of development of each field size.
Additional assumptions drive the projection of crude oil production from the coastal plain of ANWR:
- The first lease sale is assumed to take place in 2021. Congress ordered two lease sales in ANWR—the first within four years of the enactment of the law, and the second within seven years. This time allows for the development of a BLM leasing program, which includes approval of an Environmental Impact Statement, as well as the collection and analysis of additional seismic data.
- The first production from ANWR occurs at least 10 years after the first lease sale (i.e., 2031). This 10-year timeline is needed for exploration, appraisal, permitting, and development and assumes no protracted legal battle in approving the BLM’s draft Environmental Impact Statement, the BLM’s approval to collect seismic data, or the BLM’s approval of a specific lease-development proposal.
- The largest fields are brought into production first.
- New fields are sequentially developed every two years after a prior field begins production if production costs and market conditions support their development.
- Fields are assumed to take three to four years to reach peak production, maintain peak production for three to four years, and then decline until they are no longer profitable and are abandoned.
Potential production from ANWR fields is based on the size of the field discovered and the production profiles of other fields of the same size in Alaska with similar geological characteristics. The assumed field size distribution and resulting technically recoverable crude oil resources for the Mean ANWR case and the two alternate ANWR cases (Low ANWR and High ANWR) are shown in Table 1 and are based on the estimates published in the 1998 USGS assessment.
| Field Size (million barrels) | Number of Fields | Technically Recoverable Crude Oil Resources (billion barrels) | |||||
|---|---|---|---|---|---|---|---|
| Low ANWR | Mean ANWR | High ANWR | Low ANWR | Mean ANWR | High ANWR | ||
| 1,370 | 0 | 1 | 3 | 0.0 | 1.4 | 4.1 | |
| 700 | 2 | 3 | 6 | 1.4 | 2.1 | 4.2 | |
| 360 | 4 | 8 | 9 | 1.4 | 2.9 | 3.2 | |
| 180 | 8 | 12 | 13 | 1.4 | 2.2 | 2.3 | |
| 90 | 11 | 14 | 16 | 1.0 | 1.3 | 1.4 | |
| 45 | 8 | 11 | 11 | 0.4 | 0.5 | 0.5 | |
| 23 | 4 | 4 | 6 | 0.1 | 0.1 | 0.1 | |
| 12 | 0 | 0 | 0 | 0.0 | 0.0 | 0.0 | |
| Total | 37 | 53 | 64 | 5.7 | 10.4 | 16.0 | |
| Source: U.S. Energy Information Administration, Office of Energy Analysis. | |||||||
Results
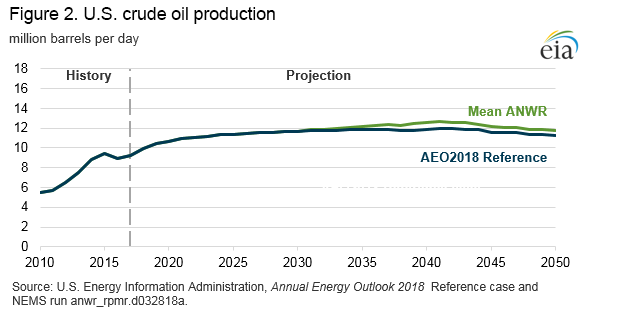
The opening of the coastal plain of ANWR to crude oil development is projected to increase domestic crude oil production starting in 2031. Crude oil prices in the Mean ANWR case are sufficient to support development in ANWR given the assumed resource base and cost estimates. Crude oil production from the coastal plain of ANWR peaks at about 880,000 barrels per day (b/d) in 2041 in the Mean ANWR case. Between 2031 and 2050, cumulative crude oil production in the United States is 3.4 billion barrels higher in the Mean ANWR case than in the AEO2018 Reference case (Figure 2).
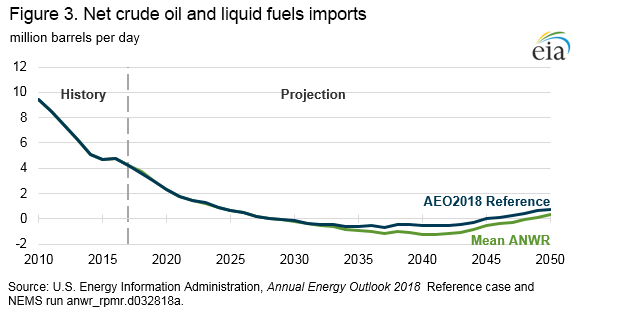
Every additional barrel of crude oil produced from ANWR is projected to reduce U.S. net imports of liquid fuels by about one barrel (Figure 3). In the AEO2018 Reference case, U.S. net imports of crude oil, petroleum products, and natural gas plant liquids are projected to decrease between 2017 and 2035. The United States is projected to be a net exporter of liquid fuels on a volume basis from 2029 to 2045, with net exports peaking near 650,000 b/d in 2037. After 2045, U.S. net imports increase, reaching almost 750,000 b/d in 2050 in the AEO2018 Reference case. The Mean ANWR case has a similar pattern of net liquid fuels imports, with the net exports of crude oil and liquid fuels reaching more than 1.2 million b/d by 2040. In 2050, U.S. net imports increase to about 300,000 b/d in the Mean ANWR case.
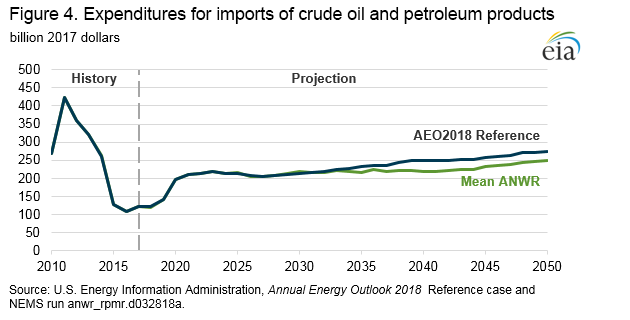
The reduction in U.S. imports of crude oil and petroleum products improves the U.S. balance of trade by reducing the levels of expenditures on crude oil and petroleum products imports (Figure 4). In the AEO2018 Reference case, cumulative U.S. expenditures on imported crude oil and petroleum products are about $4.9 trillion (2017 dollars) between 2031 and 2050. In the Mean ANWR case, comparatively higher domestic crude oil production from 2031 through 2050 reduces cumulative expenditures on imported crude oil and liquid fuels by about $409 billion (8%).
Market dynamics could limit the amount of increased Alaskan production that would be processed domestically in the projection period. Demand for gasoline declines on the West Coast through most of the projection period, which could mean tepid demand for additional crude oil to be processed to meet end-use consumption in the traditional market for Alaskan crude oil production. The availability of Jones Act-compliant vessels and constraints through high-traffic waterways on the West Coast could also limit the amount Alaskan crude oil that gets processed in domestic refineries. Given these factors, some additional volumes of Alaskan oil production would likely be exported to Asia.
Sensitivity analysis
The sensitivity of the ANWR production projections to changes in technically recoverable crude oil resources in ANWR is examined in two cases. As shown in Table 1, the technically recoverable crude oil resource in ANWR in the Low ANWR and High ANWR cases are assumed to be 5.7 billion barrels and 16.0 billion barrels, respectively. Crude oil prices are sufficient to support development in ANWR even in the Low ANWR case with the lower resource assumptions.
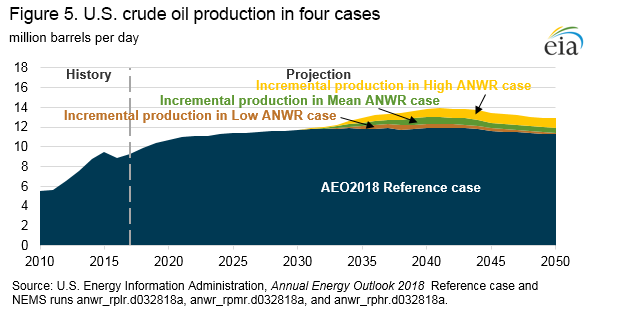
Crude oil production from the coastal plain of ANWR peaks at nearly 560,000 b/d in 2039 in the Low ANWR case and 1.2 million b/d in 2044 in the High ANWR case, compared with the peak of about 880,000 b/d in the Mean ANWR case in 2041. Between 2031 and 2050, cumulative incremental domestic crude oil production is 2.0 billion barrels in the Low ANWR case and 5.1 billion barrels in the High ANWR case, compared with 3.4 billion barrels in the Mean ANWR case (Figure 5).
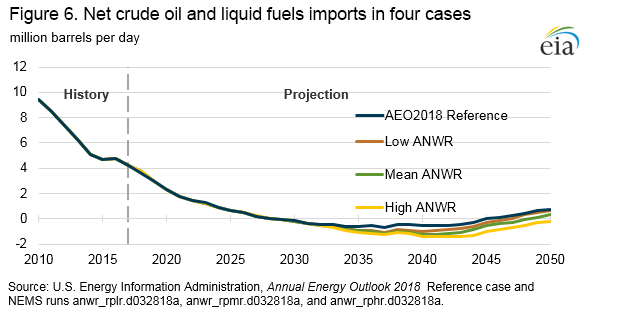
A similar pattern of net liquid fuels imports is seen in all three ANWR cases, with the maximum level of net exports of crude oil and liquid fuels reaching more than 1.1 million b/d in the Low ANWR case and 1.4 million b/d in the High ANWR case (Figure 6). In the Low ANWR case, U.S. net imports increase to about 630,000 b/d in 2050, compared with 300,000 b/d in the Mean ANWR case and 750,000 b/d in the AEO2018 Reference case. In the High ANWR case, the United States remains a small net exporter of petroleum on a volumetric basis, reaching nearly 220,000 b/d in 2050.
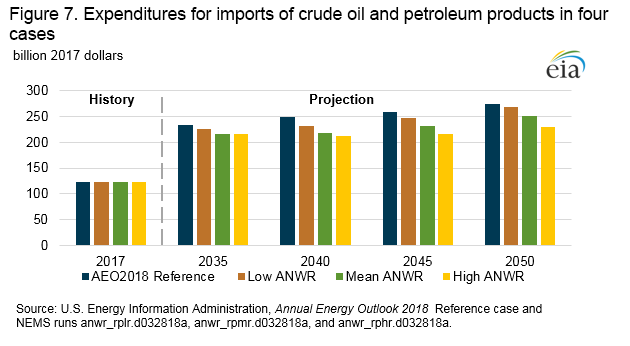
The increase in domestic crude oil production in the Low ANWR and High ANWR cases with the corresponding reduction in U.S. imports of crude oil and petroleum products also results in a reduction in U.S. expenditures on crude oil and petroleum products imports (Figure 7). In the Low ANWR and High ANWR cases, cumulative expenditures on imported crude oil and liquid fuels from 2031 through 2050 are about $200 billion (4%) lower and $595 billion (12%) lower, respectively, than in the AEO2018 Reference case.
Endnotes
-
Public Law 115-97, To provide for reconciliation pursuant to titles II and V of the concurrent resolution on the budget for fiscal year 2018, Title II, Section 20001, https://congress.gov/115/bills/hr1/BILLS-115hr1enr.pdf
-
ANWR was created by the Alaska National Interest Lands Conservation Act (ANILCA) in 1980. Section 1002 of ANILCA deferred a decision on the management of crude oil and natural gas exploration and development of 1.5 million acres of potentially productive lands in the coastal plain of ANWR.
-
The projections for Alaskan crude oil and natural gas production in AEO2018 reflect a continued ban on drilling in all areas of ANWR.
-
The Jones Act (Section 27 of the Merchant Marine Act of 1920) requires that all goods transported by water between U.S. ports be carried on ships constructed in the United States, owned by U.S. citizens, and crewed by U.S. citizens and permanent residents.
-
U.S. Geological Survey, USGS Fact Sheet FS-028-01, April 2001; https://pubs.usgs.gov/fs/fs-0028-01/fs-0028-01.pdf
-
In this analysis, any reference to ANWR pertains to all federal, state, and native lands in the Coastal Plain (1002 Area). State officials and some native corporations have expressed a strong interest in developing their respective oil resources, which are legally and economically linked to a congressional decision to allow development in ANWR.