|
Download Data (XLS File) |
|
||||||||
|
||||||||
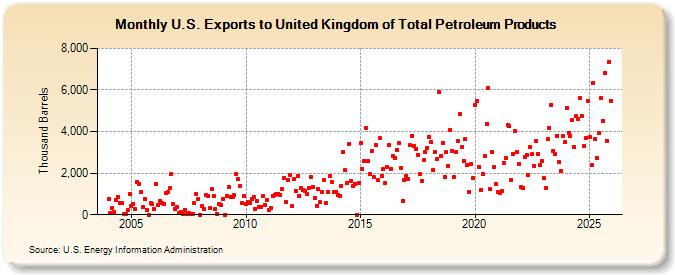
| U.S. Exports to United Kingdom of Total Petroleum Products (Thousand Barrels) | ||||||||
| Year | Jan | Feb | Mar | Apr | May | Jun | Jul | Aug | Sep | Oct | Nov | Dec |
|---|---|---|---|---|---|---|---|---|---|---|---|---|
| 2004 | 776 | 97 | 344 | 111 | 724 | 840 | 541 | 559 | 22 | 36 | 221 | 988 |
| 2005 | 410 | 538 | 279 | 1,596 | 1,470 | 1,073 | 387 | 748 | 243 | 9 | 556 | 496 |
| 2006 | 266 | 1,489 | 491 | 662 | 559 | 493 | 1,049 | 1,072 | 1,274 | 1,958 | 512 | 273 |
| 2007 | 365 | 79 | 110 | 42 | 246 | 23 | 67 | 24 | 53 | 580 | 1,003 | 740 |
| 2008 | 8 | 405 | 293 | 963 | 910 | 303 | 1,258 | 890 | 283 | 24 | 509 | 461 |
| 2009 | 776 | 2 | 896 | 1,346 | 830 | 860 | 936 | 1,940 | 1,697 | 1,402 | 546 | 886 |
| 2010 | 497 | 601 | 546 | 777 | 873 | 297 | 640 | 351 | 379 | 894 | 459 | 721 |
| 2011 | 228 | 331 | 922 | 956 | 981 | 1,014 | 946 | 1,246 | 1,779 | 604 | 1,672 | 1,931 |
| 2012 | 399 | 1,716 | 1,149 | 1,851 | 921 | 1,301 | 1,178 | 1,155 | 1,020 | 1,299 | 1,825 | 1,348 |
| 2013 | 800 | 433 | 1,213 | 591 | 1,098 | 1,651 | 571 | 1,081 | 1,861 | 1,586 | 1,076 | 1,108 |
| 2014 | 941 | 886 | 1,403 | 3,037 | 2,142 | 1,544 | 3,411 | 1,599 | 1,358 | 1,487 | 3 | 1,529 |
| 2015 | 3,429 | 2,205 | 2,581 | 4,173 | 2,581 | 1,951 | 3,060 | 1,798 | 3,371 | 1,654 | 3,692 | 1,869 |
| 2016 | 2,185 | 1,516 | 2,308 | 3,350 | 2,209 | 2,846 | 2,744 | 3,132 | 3,466 | 2,256 | 676 | 1,687 |
| 2017 | 1,872 | 1,728 | 3,362 | 3,809 | 3,329 | 3,145 | 2,889 | 1,967 | 1,623 | 2,618 | 3,005 | 3,201 |
| 2018 | 3,756 | 3,496 | 2,144 | 3,009 | 2,662 | 5,925 | 2,823 | 3,470 | 1,814 | 3,014 | 2,348 | 4,055 |
| 2019 | 3,084 | 1,809 | 2,995 | 3,552 | 4,827 | 3,243 | 2,597 | 3,638 | 2,397 | 1,114 | 2,417 | 1,768 |
| 2020 | 5,278 | 5,490 | 2,291 | 1,183 | 1,950 | 2,811 | 4,370 | 6,100 | 1,223 | 3,022 | 2,284 | 1,475 |
| 2021 | 1,103 | 1,053 | 1,131 | 2,507 | 2,717 | 4,306 | 4,278 | 1,693 | 2,935 | 4,015 | 3,016 | 2,447 |
| 2022 | 1,352 | 1,263 | 2,756 | 2,874 | 1,905 | 3,277 | 2,905 | 2,360 | 3,522 | 2,939 | 2,386 | 2,587 |
| 2023 | 1,749 | 973 | 3,623 | 4,112 | 5,280 | 3,067 | 2,636 | 3,503 | 2,658 | 2,107 | 3,774 | 2,889 |
| 2024 | 5,166 | 4,031 | 3,765 | 4,240 | ||||||||
| - = No Data Reported; -- = Not Applicable; NA = Not Available; W = Withheld to avoid disclosure of individual company data. |
| Release Date: 6/28/2024 |
| Next Release Date: 7/31/2024 |