|
Download Data (XLS File) |
|
||||||||
|
||||||||
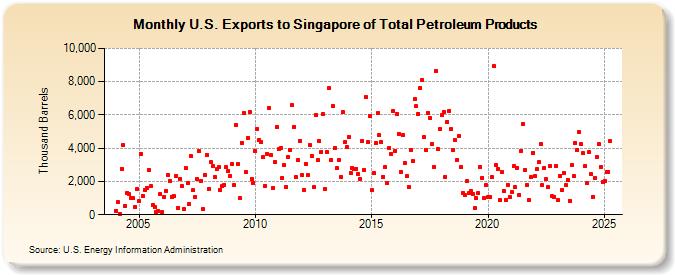
| U.S. Exports to Singapore of Total Petroleum Products (Thousand Barrels) | ||||||||
| Year | Jan | Feb | Mar | Apr | May | Jun | Jul | Aug | Sep | Oct | Nov | Dec |
|---|---|---|---|---|---|---|---|---|---|---|---|---|
| 2004 | 240 | 748 | 68 | 2,770 | 4,181 | 539 | 1,313 | 1,217 | 1,010 | 976 | 493 | 1,528 |
| 2005 | 804 | 3,675 | 1,119 | 1,486 | 1,630 | 2,698 | 1,704 | 569 | 486 | 140 | 205 | 1,246 |
| 2006 | 184 | 1,090 | 1,435 | 2,395 | 2,051 | 1,092 | 1,115 | 2,313 | 414 | 2,148 | 1,722 | 322 |
| 2007 | 2,833 | 1,881 | 656 | 3,503 | 1,466 | 1,072 | 2,138 | 3,826 | 2,039 | 320 | 2,416 | 3,610 |
| 2008 | 1,564 | 3,151 | 2,917 | 2,246 | 2,727 | 2,850 | 1,493 | 1,706 | 1,798 | 2,851 | 2,651 | 2,345 |
| 2009 | 3,024 | 1,777 | 5,402 | 3,035 | 986 | 4,328 | 6,121 | 2,567 | 4,629 | 6,168 | 2,145 | 1,933 |
| 2010 | 3,844 | 5,175 | 4,493 | 4,351 | 3,448 | 1,747 | 3,667 | 6,445 | 3,569 | 1,615 | 3,167 | 5,298 |
| 2011 | 3,944 | 4,010 | 2,230 | 2,975 | 1,691 | 3,471 | 3,920 | 6,573 | 5,279 | 2,246 | 3,291 | 4,462 |
| 2012 | 2,375 | 1,511 | 3,068 | 2,365 | 4,185 | 3,547 | 1,659 | 5,992 | 3,281 | 4,426 | 3,800 | 6,049 |
| 2013 | 1,549 | 3,757 | 7,608 | 3,304 | 6,512 | 4,034 | 2,786 | 3,302 | 2,289 | 6,146 | 4,342 | 4,060 |
| 2014 | 4,673 | 2,518 | 2,797 | 2,762 | 2,757 | 2,462 | 2,156 | 4,446 | 2,690 | 7,064 | 4,344 | 5,949 |
| 2015 | 1,494 | 2,496 | 4,283 | 6,111 | 4,777 | 4,354 | 2,294 | 2,855 | 1,905 | 4,020 | 3,661 | 6,227 |
| 2016 | 3,853 | 6,059 | 4,879 | 2,589 | 4,763 | 3,135 | 2,334 | 1,671 | 3,878 | 3,215 | 6,933 | 6,520 |
| 2017 | 6,083 | 7,640 | 8,114 | 4,667 | 3,882 | 6,142 | 5,833 | 4,255 | 2,878 | 8,627 | 3,945 | 5,144 |
| 2018 | 5,988 | 6,205 | 2,274 | 5,596 | 6,254 | 5,134 | 3,866 | 4,496 | 3,308 | 4,748 | 2,869 | 1,318 |
| 2019 | 1,157 | 2,007 | 1,311 | 1,411 | 1,268 | 401 | 984 | 1,305 | 2,866 | 2,228 | 987 | 1,764 |
| 2020 | 1,089 | 1,065 | 2,249 | 8,918 | 2,963 | 2,739 | 889 | 2,574 | 1,435 | 909 | 1,803 | 1,049 |
| 2021 | 1,364 | 2,912 | 1,662 | 2,824 | 1,210 | 3,839 | 5,463 | 2,716 | 1,773 | 860 | 2,263 | 3,732 |
| 2022 | 2,317 | 2,737 | 3,166 | 4,247 | 1,760 | 2,809 | 2,130 | 1,665 | 2,917 | 1,101 | 1,075 | 2,929 |
| 2023 | 1,080 | 1,740 | 618 | 3,121 | 2,172 | 1,910 | 618 | 2,935 | 2,088 | 4,112 | 4,793 | 5,044 |
| 2024 | 4,242 | |||||||||||
| - = No Data Reported; -- = Not Applicable; NA = Not Available; W = Withheld to avoid disclosure of individual company data. |
| Release Date: 3/29/2024 |
| Next Release Date: 4/30/2024 |