|
Download Data (XLS File) |
|
||||||||
|
||||||||
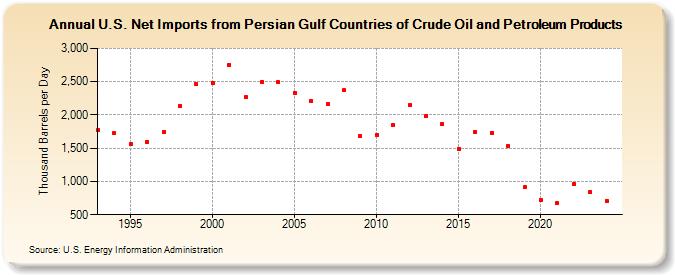
| U.S. Net Imports from Persian Gulf Countries of Crude Oil and Petroleum Products (Thousand Barrels per Day) | ||||||||
| Decade | Year-0 | Year-1 | Year-2 | Year-3 | Year-4 | Year-5 | Year-6 | Year-7 | Year-8 | Year-9 |
|---|---|---|---|---|---|---|---|---|---|---|
| 1990's | 1,774 | 1,723 | 1,563 | 1,595 | 1,747 | 2,132 | 2,459 | |||
| 2000's | 2,483 | 2,757 | 2,265 | 2,497 | 2,489 | 2,330 | 2,208 | 2,159 | 2,368 | 1,678 |
| 2010's | 1,705 | 1,842 | 2,149 | 1,988 | 1,861 | 1,494 | 1,744 | 1,733 | 1,528 | 910 |
| 2020's | 727 | 675 | 967 | 845 |
| - = No Data Reported; -- = Not Applicable; NA = Not Available; W = Withheld to avoid disclosure of individual company data. |
| Release Date: 8/30/2024 |
| Next Release Date: 8/29/2025 |