|
Download Data (XLS File) |
|
||||||||
|
||||||||
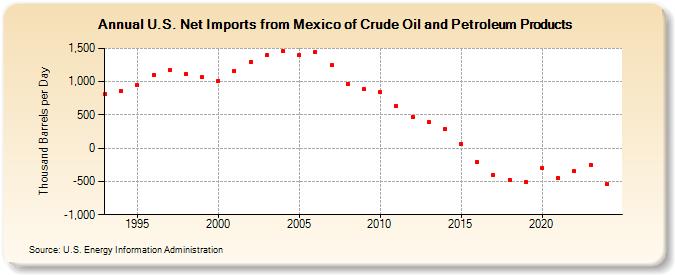
| U.S. Net Imports from Mexico of Crude Oil and Petroleum Products (Thousand Barrels per Day) | ||||||||
| Decade | Year-0 | Year-1 | Year-2 | Year-3 | Year-4 | Year-5 | Year-6 | Year-7 | Year-8 | Year-9 |
|---|---|---|---|---|---|---|---|---|---|---|
| 1990's | 809 | 860 | 943 | 1,101 | 1,178 | 1,116 | 1,063 | |||
| 2000's | 1,015 | 1,166 | 1,292 | 1,395 | 1,456 | 1,394 | 1,450 | 1,254 | 969 | 888 |
| 2010's | 837 | 637 | 470 | 387 | 283 | 68 | -211 | -398 | -475 | -507 |
| 2020's | -291 | -445 | -344 | -255 |
| - = No Data Reported; -- = Not Applicable; NA = Not Available; W = Withheld to avoid disclosure of individual company data. |
| Release Date: 6/28/2024 |
| Next Release Date: 8/30/2024 |