|
Download Data (XLS File) |
|
||||||||
|
||||||||
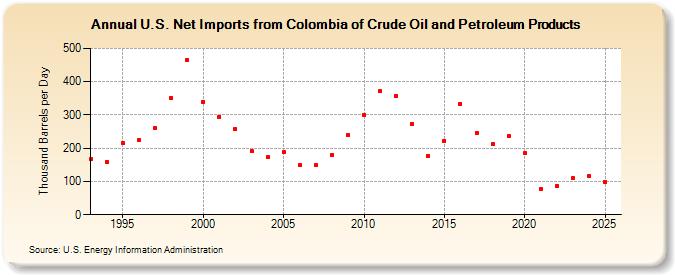
| U.S. Net Imports from Colombia of Crude Oil and Petroleum Products (Thousand Barrels per Day) | ||||||||
| Decade | Year-0 | Year-1 | Year-2 | Year-3 | Year-4 | Year-5 | Year-6 | Year-7 | Year-8 | Year-9 |
|---|---|---|---|---|---|---|---|---|---|---|
| 1990's | 168 | 159 | 215 | 225 | 260 | 352 | 466 | |||
| 2000's | 340 | 295 | 258 | 192 | 173 | 188 | 149 | 148 | 181 | 240 |
| 2010's | 300 | 371 | 358 | 273 | 178 | 223 | 334 | 246 | 212 | 237 |
| 2020's | 185 | 78 | 87 | 113 |
| - = No Data Reported; -- = Not Applicable; NA = Not Available; W = Withheld to avoid disclosure of individual company data. |
| Release Date: 3/29/2024 |
| Next Release Date: 8/30/2024 |